Figure 2.

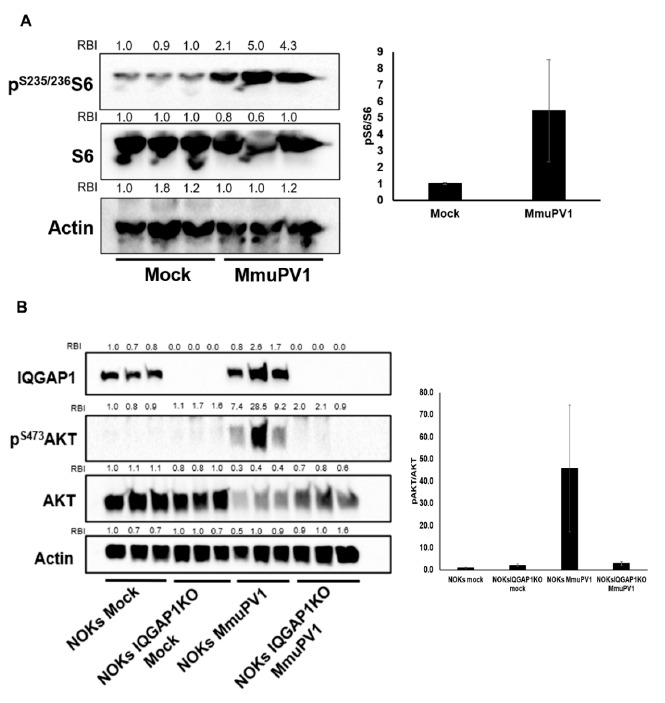
MmuPV1 infection induces PI3K signaling in keratinocytes. (A) MmuPV1 infection induces PI3K signaling in primary mouse keratinocytes. Left: immunoblotting detection of S6 activation levels in mock-infected and MmuPV1-infected primary mouse keratinocytes. Relative band intensity (RBI) was calculated by normalizing to the first mock-infected lane from the left. Right: quantification of the band intensity. PI3K signaling level was represented by the ratio of phosphorylated S6 (activated form of S6 protein) over total S6. Statistics: mock vs. MmuPV1, p = 0.069, two-sided t-test. (B) MmuPV1 infection induces PI3K signaling in NOKs via an IQGAP1-dependent mechanism. Left: immunoblot detection of AKT activation levels in mock-infected and MmuPV1-infected NOKs and NOKs IQGAP1KO cells. RBI was calculated by normalizing to the first mock-infected NOKs lane from the left. Right: quantification of band intensity. The PI3K signaling level was represented by the ratio of phosphorylated AKT (activated form of AKT protein) over total AKT. Statistics: NOKs mock vs. NOKs MmuPV1, p = 0.053; NOKs MmuPV1 vs. NOKs IQGAP1KO MmuPV1, p = 0.06; NOKs IQGAP1KO Mock vs. NOKs IQGAP1KO MmuPV1, p = 0.25, two-sided t-test. Note: all uncropped western blot images for this study are summarized in Figure S8.
