Fig. 3.
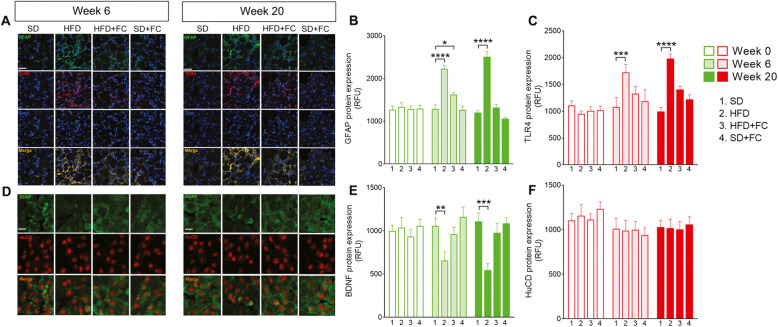
HFD evokes glial activation in the nodose ganglia after 20 weeks on diet. Immunofluorescence images show the expression of GFAP (green), TLR4 (red), and Dapi (blue) in the nodose ganglia and relative immunolabeling quantification at weeks 6 and 20 (a–c) of the diet protocol. BDNF (green) and HuCD (red) expression in nodose ganglia and relative quantification is shown at the same time points (d–f). Data were analyzed by 2-way ANOVA and Dunnett post hoc. Results are expressed as average relative fluorescence units (RFU) ± SEM per area unit of n assessments. *P<0.05, **P<0.01, ***P<0.001, and ****P<0.0001 versus relative SD group. Scale bar = 20 μm

