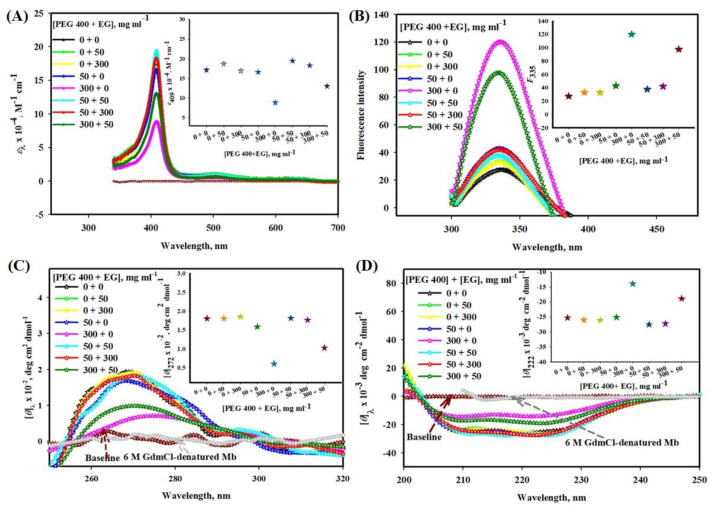
Figure 1.
(A) Absorption, (B) tryptophan fluorescence, (C) near-UV CD and (D) far-UV CD spectra of Mb with different concentration mixtures of PEG 400 and EG. Insets of (A), (B), (C) and (D) displays a plot of ε409, F335, [θ]272 and [θ]222 versus various [PEG 400 + EG], where different color stars depicts different [PEG 400 + EG]. All experiments were made at pH 7.0 and 25 °C.

