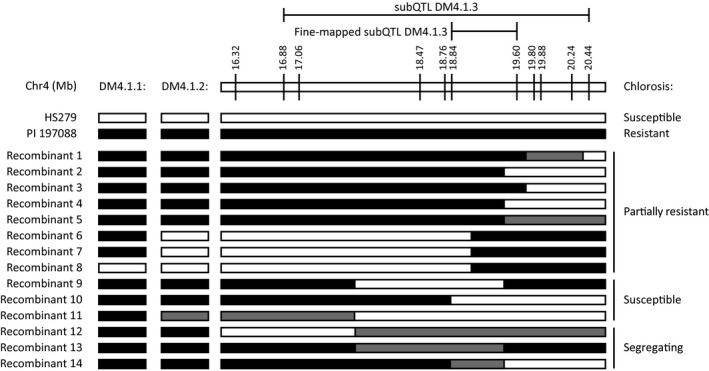
FIGURE 1.

Fine‐mapping subQTL DM4.1.3. Screening of individuals derived from the mapping population allowed identification of additional informative recombinants within the DM4.1.3 interval. Bars represent genotypes at marker locations. Black bars indicate the PI 197088 allele, white bars indicate the HS279 allele, grey bars represent heterozygosity. Individuals were self‐fertilized to develop populations, which were phenotyped regarding chlorosis
