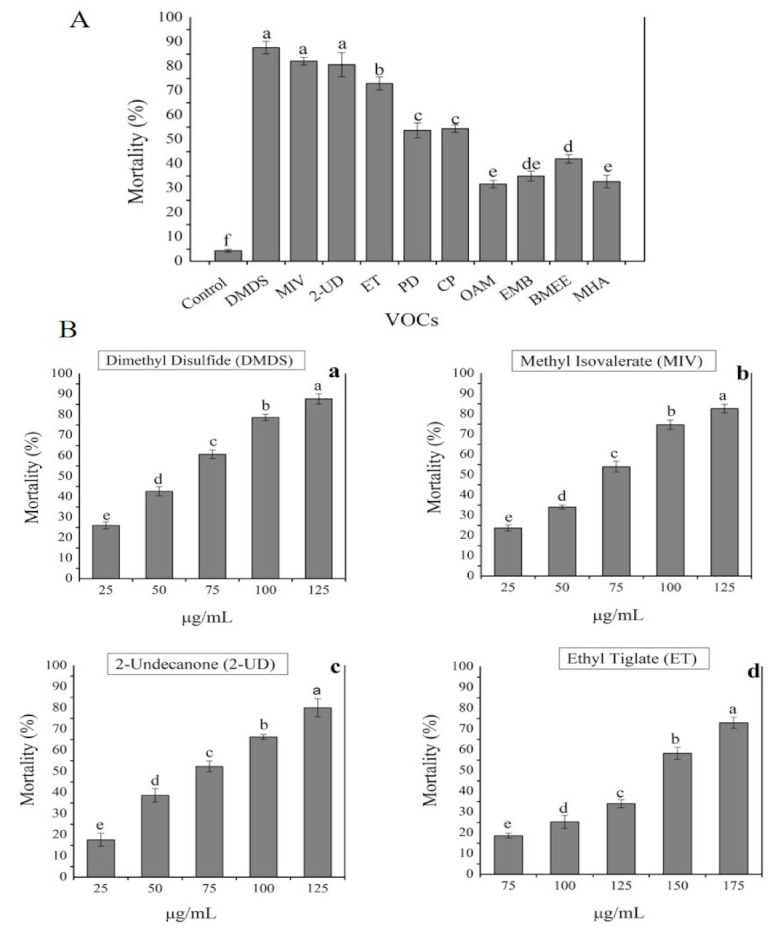
Figure 4.

Nematicidal effect of pure VOCs with different concentrations against M. incognita. (A) The mortality rate of each pure VOC compared with control. (B) The killing effect of four strong nematicidal VOCs (a–d) with different concentrations. The error bars represent the mean standard deviation of each treatment repeated three times with three replicates. The small letters above the columns indicate significant difference. The significance differences among treatments were calculated by Tukey’s HSD test at p ≤ 0.05.
