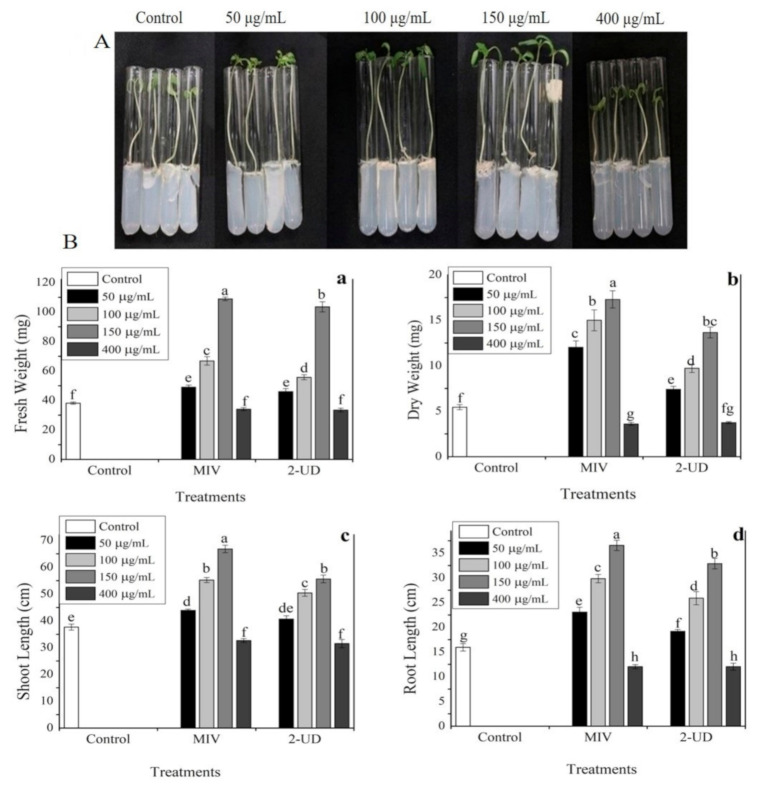
Figure 6.
The exposure of tomato seedlings to pure VOCs, i.e., methyl isovalerate (MIV) and 2-undecaone (2-UD), at different concentrations of (50 µg/mL, 100 µg/mL, 150 µg/mL, and 400 µg/mL) grown in test tubes kept in an airtight jar for 12 days at 25 °C under 12/12 h dark photoperiod. (A) Visual presentation of methyl isovalerate (MIV) effect on tomato plant growth. (B) Growth parameters recorded: (a) fresh weight (b) dry weight, (c) shoot length, and (d) root length. Error bar represents the mean standard deviation of each treatment. The small letters above the columns indicate significant difference. The significant difference between the treatments was determined through Tukey’s HSD test at p ≤ 0.05.

