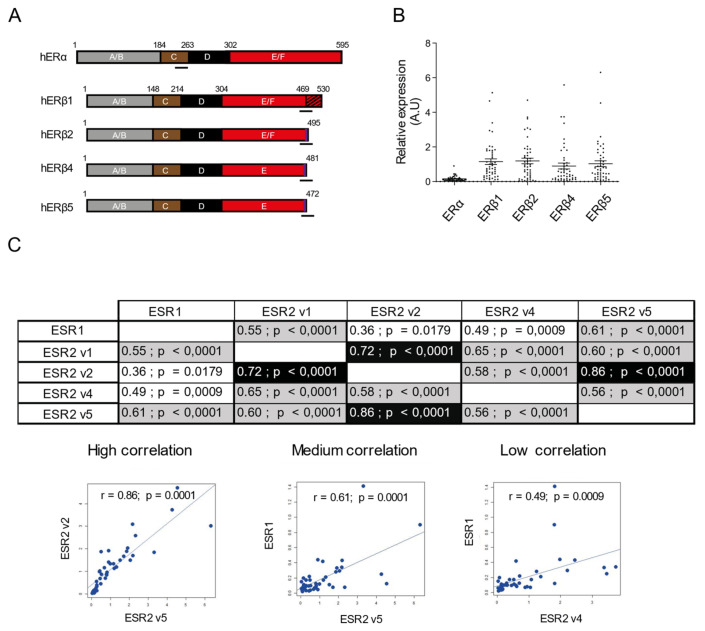
Figure 1.
ERβ isoform mRNAs are highly expressed in hGCs with positive correlations between pairs of ERβ isoforms. (A) Schematic representation of ovarian human ERα and ERβ (hER). The A/B domain at the NH2 terminus contains the AF-1 site, where other transcription factors interact. The C/D domain (brown/black boxes) contains the two-zinc finger structure that binds to DNA, and the E/F domain (red box) contains the ligand binding pocket as well as the AF-2 domain, which directly contacts coactivator peptides. ERβ spliced isoforms are formed from alternative splicing of the last coding exon (shown by the striped bar); ERβ isoforms are identical in their first 468 amino acids but differ in the sequence corresponding to the end of the ligand binding of ERβ1. Approximate locations of the primers used for qPCR are indicated. (B) hGCs were cultured for 24 h before RNA extraction. Relative levels of ERα (ESR1) and ERβ1 (ESR2 v1), ERβ2 (ESR2 v2), ERβ4 (ESR2 v4), and ERβ5 (ESR2 v5) isoforms mRNAs were determined by RT-qPCR analysis for each patient (n = 49). Transcript levels were normalized to GAPDH transcripts abundance. Values are represented as means ± SEM from two or three identical wells per patient, measured in triplicate. (C) We evaluated the correlations between relative mRNAs levels of each pair of genes. Data are represented in the table; correlation values are categorized as “high” r > 0.65 (black highlighted), “medium” r between 0.5 and 0.65 (grey highlighted), and “low” r < 0.5. An example of the relationship between mRNA abundances for each category is represented by the fitted (log) blue line (----). Significance values from Pearson correlations are given on the graphs.

