Figure 1.
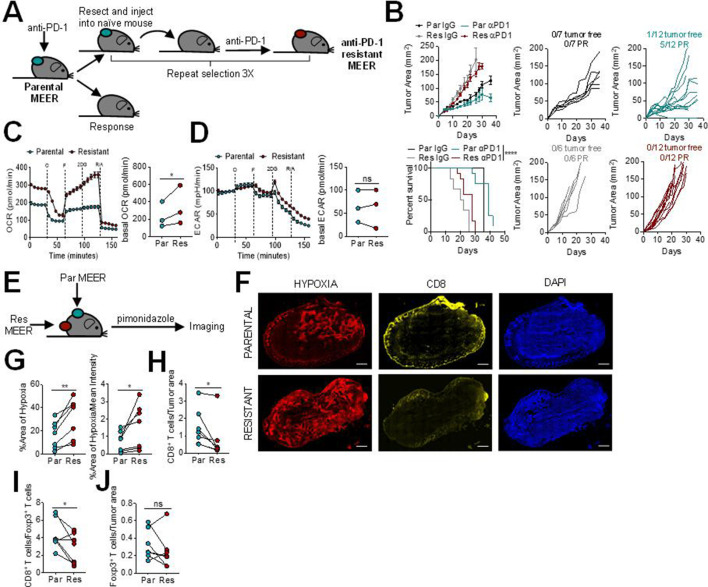
Programmed cell death protein 1 (PD-1) blockade resistance leads to increased tumor cell oxidative metabolism and intratumoral hypoxia. (A) Schematic of PD-1 resistant murine head and neck cancer cell model, MEER cell line generation. (B) Growth curve and survival of C57/BL6 mice inoculated with parental or PD-1 resistant MEER cells intradermally then treated with 200 µg anti-PD-1 or isotype controls three times per week when tumors reached 1–3 mm. Tumor-free indicates a complete regression. Partial response (PR) indicates mice that showed tumor regression for at least two measurements. Each line represents one animal. (C) Oxygen consumption rate (OCR) trace (left) and tabulated basal OCR (right) of parental and PD-1 resistant MEER cells. (D) Extracellular acidification rate (ECAR) trace (left) and tabulated basal ECAR (right) as in (C). (E) Schematic of imaging preformed on parental and PD-1 resistant MEER cells. (F) Pimonidazole, CD8, and DAPI staining of full tumor sections from mice bearing parental and PD-1 resistant MEER tumors. Scale bar, 500 µm. (G) Tabulated results of the internal hypoxyprobe area and intensity from mice as in (F). (H) CD8+ T cell counts normalized to tumor area from mice as in (F). (I) Ratio of CD8+ T cells and Foxp3+ T cells from mice as in (F). (J) Foxp3+ T cell counts normalized to tumor area from mice as in (F). Data represent two to three independent experiments. *p<0.05, **p<0.01, ****p<0.0001, ns not significant by ratio paired t-test (C, D) paired t-test (G–J), or logrank test (B). Error bars indicate SEM.

