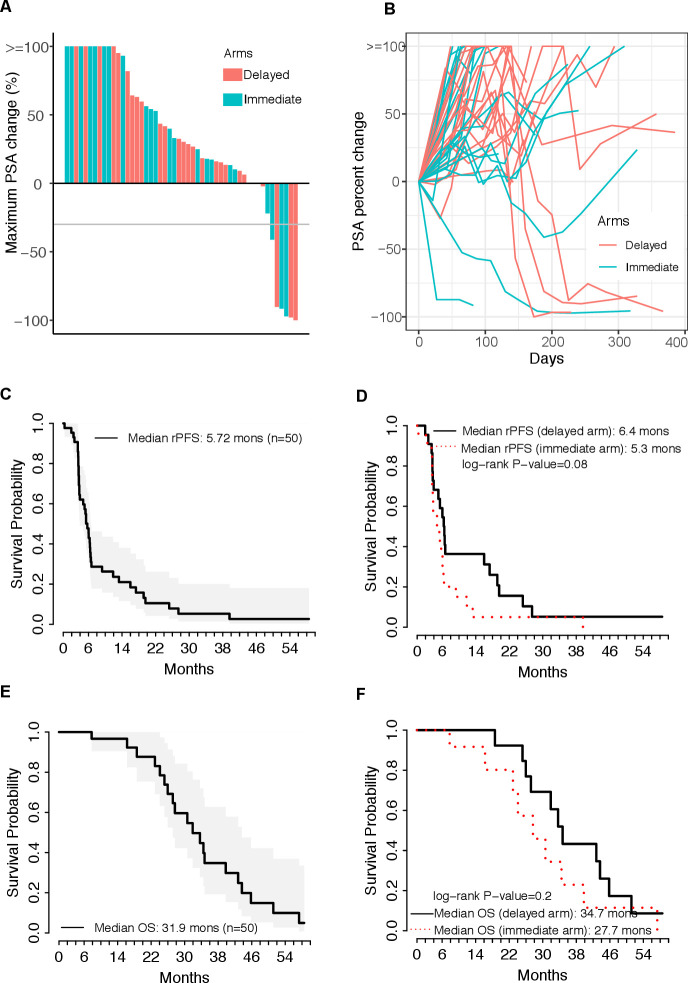
Figure 1.
Clinical outcomes. (A) Prostate-specific antigen (PSA) waterfall plot showing the maximal percent change in PSA compared with baseline. (B) Spider plot of PSA at baseline and subsequent changes compared with baseline. (C) Kaplan-Meier plot of time to radiographic progression. Time to radiographic progression was defined as the time from randomization to the date of documented radiographic progression or last available follow-up date. (D) Kaplan-Meier plots of time to radiographic progression separated by treatment cohort. (E) Kaplan-Meier plot of overall survival (OS). OS was defined as the time from randomization to the date of death or last available follow-up date. (F) Kaplan-Meier plots of OS separated by treatment cohort. Comparisons made by log-rank test, with p<0.05 considered statistically significant. rPFS, radiographic progression-free survival.

