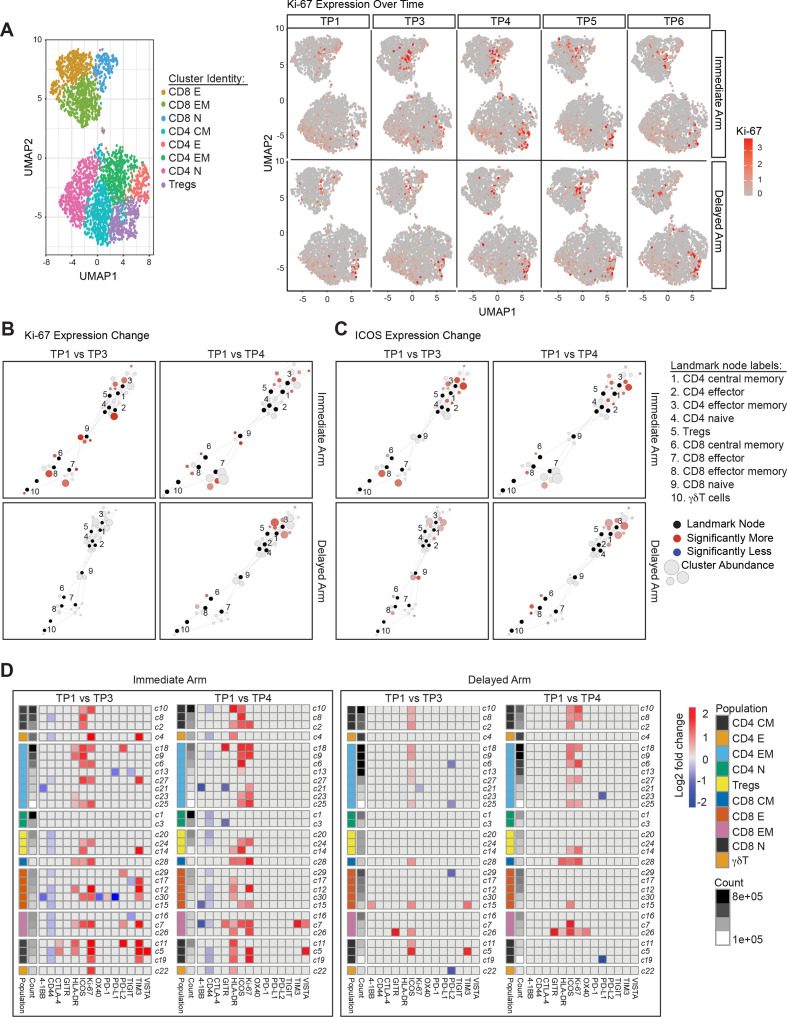
Figure 3.
Systemic immune modulation with combination immunotherapy treatment. (A) On the left, a uniform manifold approximation and projection (UMAP) plot of CD3+ T cells from all assessed peripheral blood mononuclear cell (PBMC) samples is shown. Clusters corresponding to canonical T cell subsets are represented using distinct colors. On the right, relative intensity of Ki-67 expression over time is shown for both the immediate and delayed arms of the clinical study. Scaffold maps of significant changes in the percent of Ki-67 (B) or inducible costimulator (ICOS) (C) positive T cell clusters are shown. Clusters are shown when comparing timepoint (TP) 3 or TP4 with pretreatment timepoint TP1 in the immediate and delayed arms of the study. Black-colored nodes in the scaffold maps represent landmark nodes that are canonical T cell types identified by traditional manual cellular gating. The remaining nodes represent the 30 unsupervised T cell clusters created by scaffold analysis. These are arranged around the landmark nodes and each other based on similarity and connected by edges, the length of which is dependent on cluster similarity. The size of the clusters is proportional to cellular abundance. The color coding represents clusters that exhibited significant differences (q<0.05; red=increase, blue=decrease) in percent marker-positive clusters when comparing different two groups. (D) Heatmaps summarizing log2 fold changes resulting from statistical scaffold analysis of functional markers 4-1BB, CD44, CTLA-4, GITR, HLA-DR, ICOS, Ki-67, OX40, PD-1, PD-L1, PD-L2, TIGIT, TIM3 and VISTA when comparing pretreatment timepoint TP1 with TP3 and also with TP4 are shown for the immediate and delayed arms. Each box in the heatmap represents a T cell cluster, which has been labeled according to the nearest landmark node that they connect to on a scaffold map and ordered by cell count abundance. The color coding represents clusters that showed a significant difference (q<0.05) in the log2 fold change, with red being significantly higher, while blue being significantly lower in group 2 of the two comparison groups. The intensity of the color code is proportional to the log2 fold change and is capped at 2 and −2.

