Figure 4.
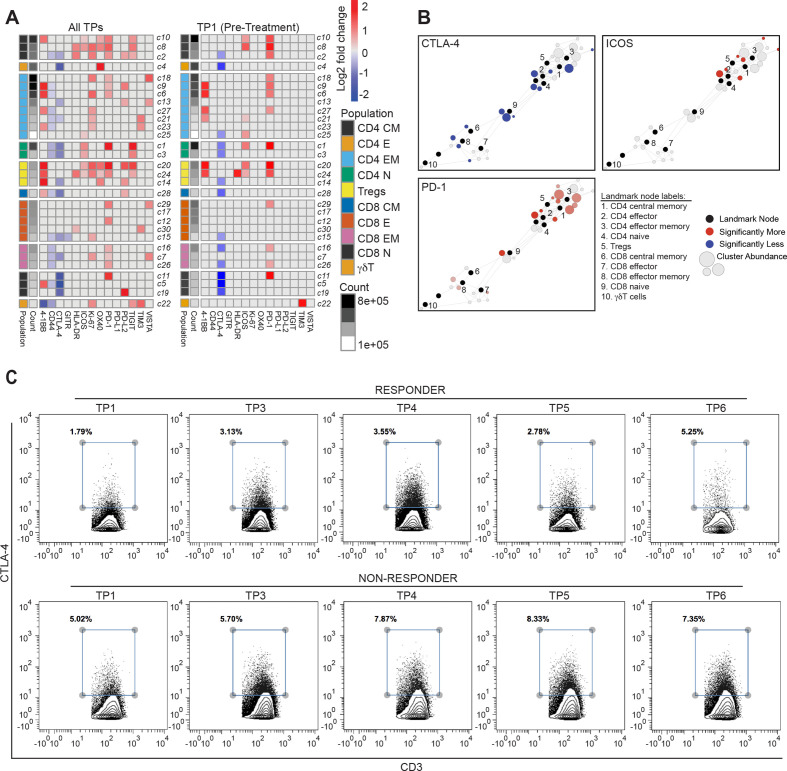
T cell functional states differ in clinical responders compared with non-responders. (A) Heatmaps summarizing log2 fold changes resulting from statistical scaffold analysis of functional markers 4-1BB, CD44, CTLA-4, GITR, HLA-DR, ICOS, Ki-67, OX40, PD-1, PD-L1, PD-L2, TIGIT, TIM3 and VISTA are shown for all timepoints (TPs) combined (left panel) and only at pretreatment TP1 (right panel) when comparing responders with non-responders as defined by PSA30 responses. Each box in the heatmap represents a T cell cluster, which has been labeled according to the nearest landmark node that they connect to on a scaffold map and ordered by cell count abundance. The color coding represents clusters that showed a significant difference (q<0.05) in the log2 fold change, with red being significantly higher, while blue being significantly lower in group 2 of the two comparison groups. The intensity of the color code is proportional to the log2 fold change is and capped at 2 and −2. (B) Scaffold maps for significant changes in CTLA-4, inducible costimulator (ICOS) and PD-1 are shown when comparing non-responders with responders across the entire study at pretreatment TP1. (C) Contour plots from Cytobank manual gating analysis show the percent CTLA-4+ T cells (gated on all CD3+) in a responder (top row) and a non-responder (bottom row) across the various TPs in the study.

