Figure 5.
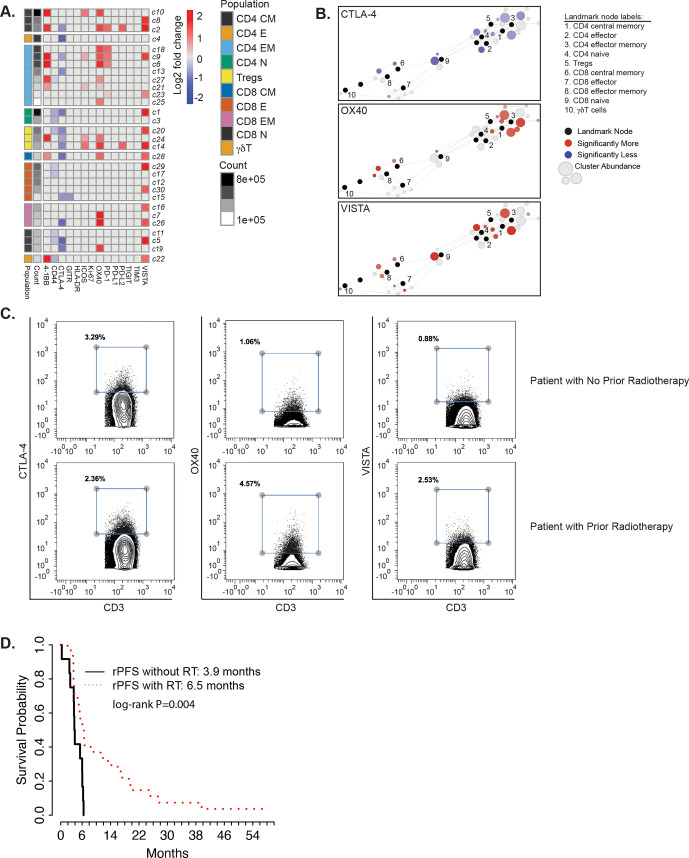
Altered T cell functional states in patients with or without prior radiation therapy (RT). (A) Heatmaps summarizing log2 fold changes resulting from statistical scaffold analysis of functional markers 4-1BB, CD44, CTLA-4, GITR, HLA-DR, ICOS, Ki-67, OX40, PD-1, PD-L1, PD-L2, TIGIT, TIM3 and VISTA are shown for the pretreatment timepoint when comparing patients that did not receive radiotherapy to patients that did. Each box in the heatmap represents a T cell cluster, which has been labeled according to the nearest landmark node that they connect to on a scaffold map and ordered by cell count abundance. The color coding represents clusters that showed a significant difference (q<0.05) in the log2 fold change, with red being significantly higher, while blue being significantly lower in the RT-treated patients versus patients who did not receive RT. The intensity of the color code is proportional to the log2 fold change and is capped at 2 and −2. (B) Scaffold maps for significant changes in CTLA-4, OX40 and VISTA are shown when comparing patients without prior radiotherapy to those with prior radiotherapy across the entire study at pretreatment timepoint. Black-colored nodes in the scaffold maps represent landmark nodes that are canonical T cell types identified by traditional manual cellular gating. The remaining nodes represent the 30 unsupervised T cell clusters created by scaffold analysis. These are arranged around the landmark nodes and each other based on similarity and connected by edges, the length of which is dependent on cluster similarity. The size of the clusters is proportional to cellular abundance. The color coding represents clusters that exhibited significant differences (q<0.05; red=increase, blue=decrease) in percent marker-positive clusters when comparing different two groups. The color intensity is proportional to the log2 fold change in the scaffold analysis. (C) Contour plots from Cytobank manual gating analysis showing the percent CTLA-4+, OX40+ and VISTA+ T cells (gated on all CD3+) in a patient with no prior radiotherapy (top row) and a patient with prior radiotherapy (bottom row) at TP1. (D) Kaplan-Meier plots of time to radiographic progression separated by treatment cohort. Comparisons are made by log-rank test, with *p<0.05 considered statistically significant. rPFS, radiographic progression-free survival.

