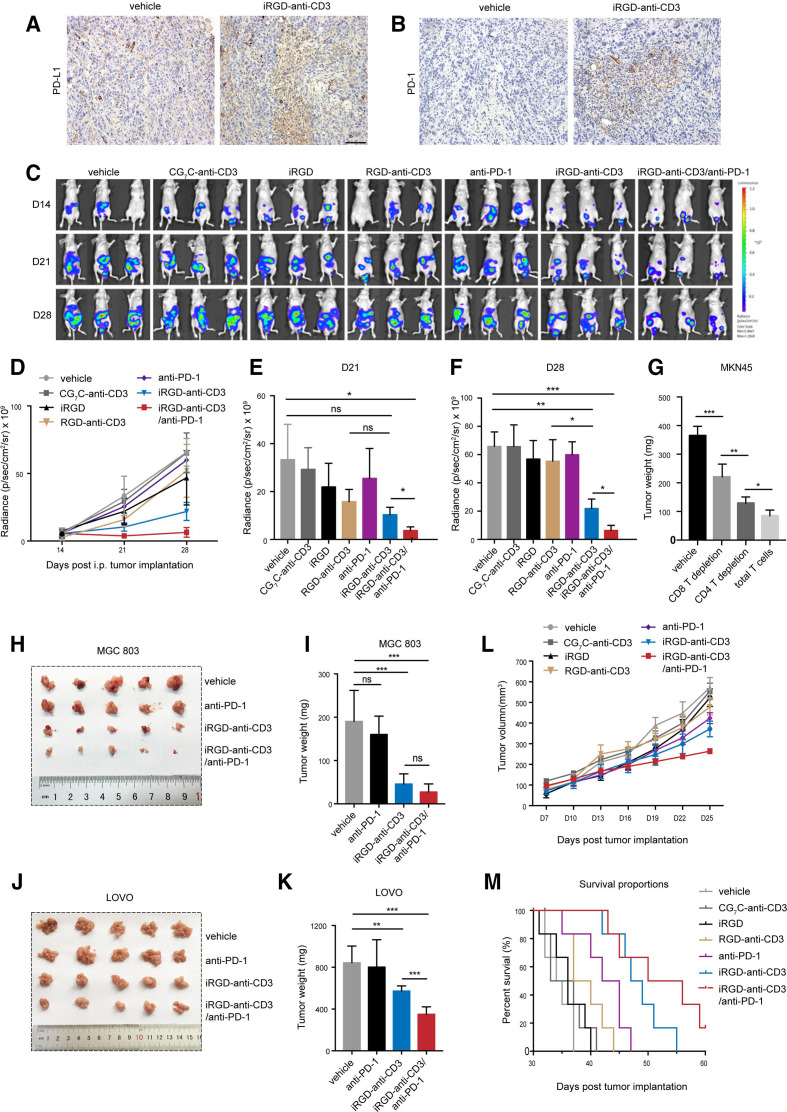
Figure 4.
Combination of iRGD-anti-CD3-modified T cells with PD-1 blockade effectively controlled tumor growth. (A) Immunohistochemistry analysis of PD-L1 and (B) PD-1 expression in peritoneal tumors. Scale bar, 100 µm. (C–F) MKN45-luc peritoneal metastasis tumor model, n=3. Two weeks after tumor implantation (day 15), 1×10⁷ T cells modified with 100 µg iRGD-anti-CD3 or control reagents or codelivered with 3 µg free iRGD were given intraperitoneally every other day for 5 days. PD-1 blockade of 250 µg was given intraperitoneally every other day for a total of three doses. (C) Anterior bioluminescence images of tumor burden at days 14 (before treatment), 21 and 28 after tumor inoculation. (D) Curves of tumor signal at three indicated timepoints during the treatment course. (E) Tumor signal quantification at 21 days and (F) 28 days after tumor inoculation. (G) 1×10⁷ total T cells or with CD8/CD4 depletion were modified with 100 µg iRGD-anti-CD3 and then injected into mice bearing disseminated MKN45 peritoneal tumors every other day three times. PD-1 blockade of 250 µg was given intraperitoneally every other day for three injections. Tumors were harvested after 2 weeks of treatment and weighed. (H) Tumor nodules in all treatment groups were photographed and (I) weighed in the MGC803 peritoneal metastatic tumor model. (J) Representative images and (K) weight of excised tumors in LOVO peritoneal metastasis tumor model. (L) Tumor growth profiles and (M) survival analysis in MKN45 subcutaneous mouse model, n=6. Data are analyzed with Student’s t-test unless specified, and are represented as mean±SEM; *p<0.05,**p<0.01, ***p<0.001. ns, not significant.

