. 2021 May 3;18(3):261–272. doi: 10.21873/cgp.20257

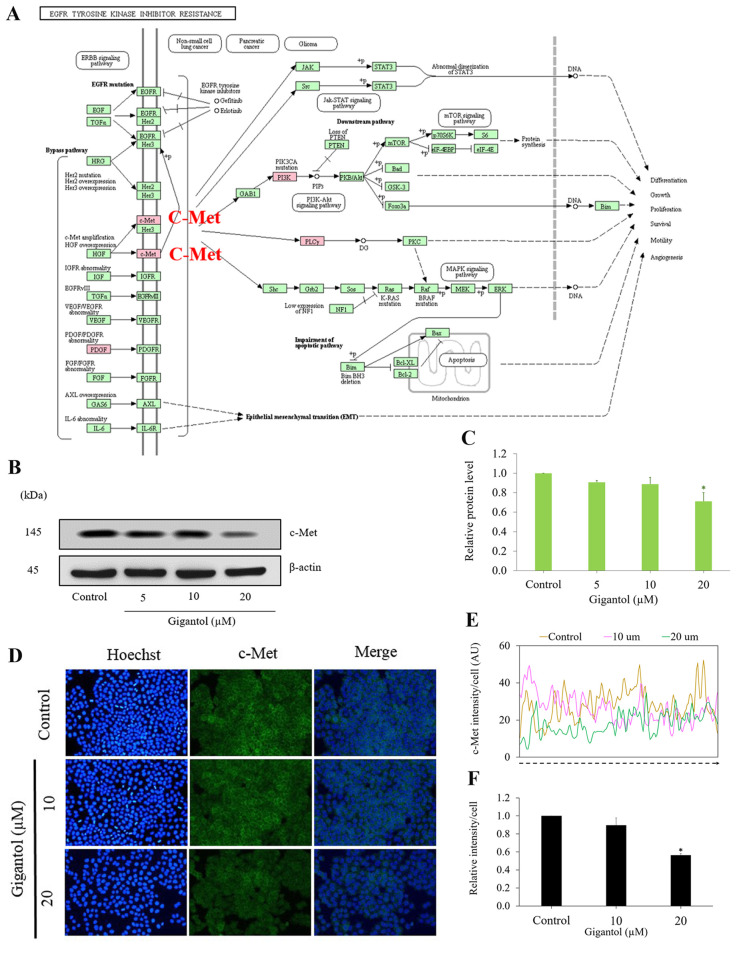
Figure 3. The c-Met-dependent pathway is a target of gigantol. (A) Effect of gigantol on the down-regulated proteins related to cell migration through EGFR tyrosine kinase inhibitor resistance obtained from the KEGG Pathway Database (https://www.genome.jp/kegg/mapper.html). The red box represents the down-regulated proteins, including c-Met: Met; PI3K: PIK3CA, PIK3CD; PLC gamma: PLCG1, and PLCG2. (B) The c-Met protein expression was determined by western blotting. H460 cells were treated with 0-20 μM gigantol for 24 h. β-actin was used to confirm the equal loading of each protein sample. (C) The band intensities of the treatment groups were quantified by densitometry, and the results are presented as a relative protein level. Data represent the mean±SD (n=3; *p<0.05 compared with the untreated control). (D-F) The c-Met protein signal was determined by immunofluorescence. The fluorescence intensity was analyzed by ImageJ software. Values are the mean±S.E.M. (n=3). *p<0.05 compared to untreated cells.

Figure 3