
Figure 3.
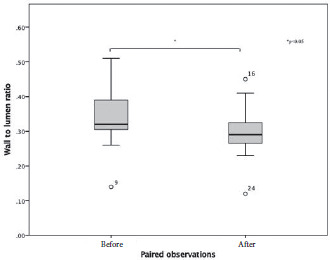
Box-plot of the values of wall to lumen ratio, with significant outliers plotted on the graph as points outside the box-plots.
Official websites use .gov
A
.gov website belongs to an official
government organization in the United States.
Secure .gov websites use HTTPS
A lock (
) or https:// means you've safely
connected to the .gov website. Share sensitive
information only on official, secure websites.
Box-plot of the values of wall to lumen ratio, with significant outliers plotted on the graph as points outside the box-plots.