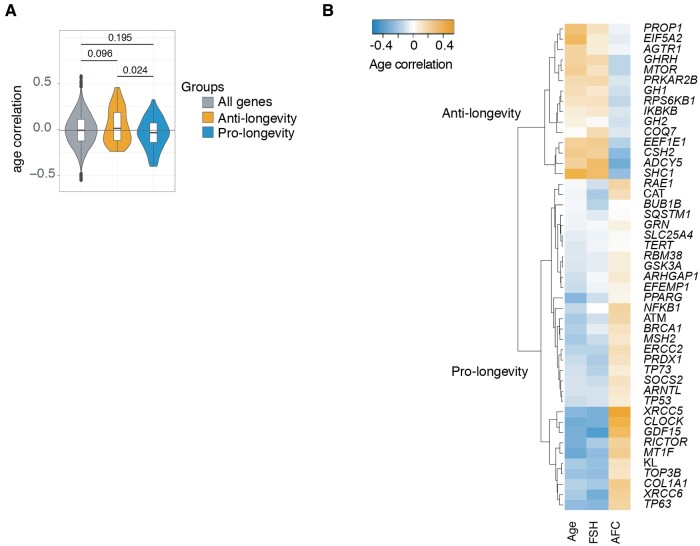
Figure 2.
Ageing regulation of anti- and pro-longevity genes in human oocyte transcriptomes. (A) Distributions of correlations of all genes (grey), GeneAge anti-longevity genes (orange) and GeneAge pro-longevity genes (blue) and their significant differences. Distributions were compared with an ANOVA, and the Tukey Honest Significant Difference method was used to control for the Type I error rate across multiple comparisons. The 0.024 P value denotes a significant difference between how anti-longevity genes and pro-longevity genes associate with age, which is in opposing directions. The changes in direction are opposite to what would be required for a longevity benefit. (B) Selection of GeneAge anti- and pro-longevity genes that correlated with age in a manner opposite to what would be required for a longevity benefit. Correlations between individuals’ ages and ranked expression data were assessed using Pearson's product moment correlation coefficient.

