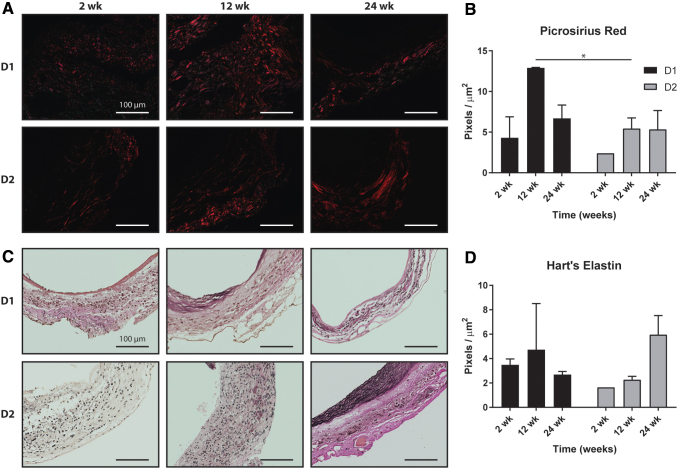
FIG. 6.
(A) Picrosirius red staining of fibrillar collagen (red) for Design 1 and Design 2 grafts at 2, 12, and 24 weeks postimplantation and (B) the related quantification. (C) Hart's staining of elastic fibers for Design 1 and Design 2 grafts at 2, 12, and 24 weeks postimplantation and (D) the related quantification. Statistical comparisons indicate p < 0.05 (*). All scale bars are 100 μm. Color images are available online.

