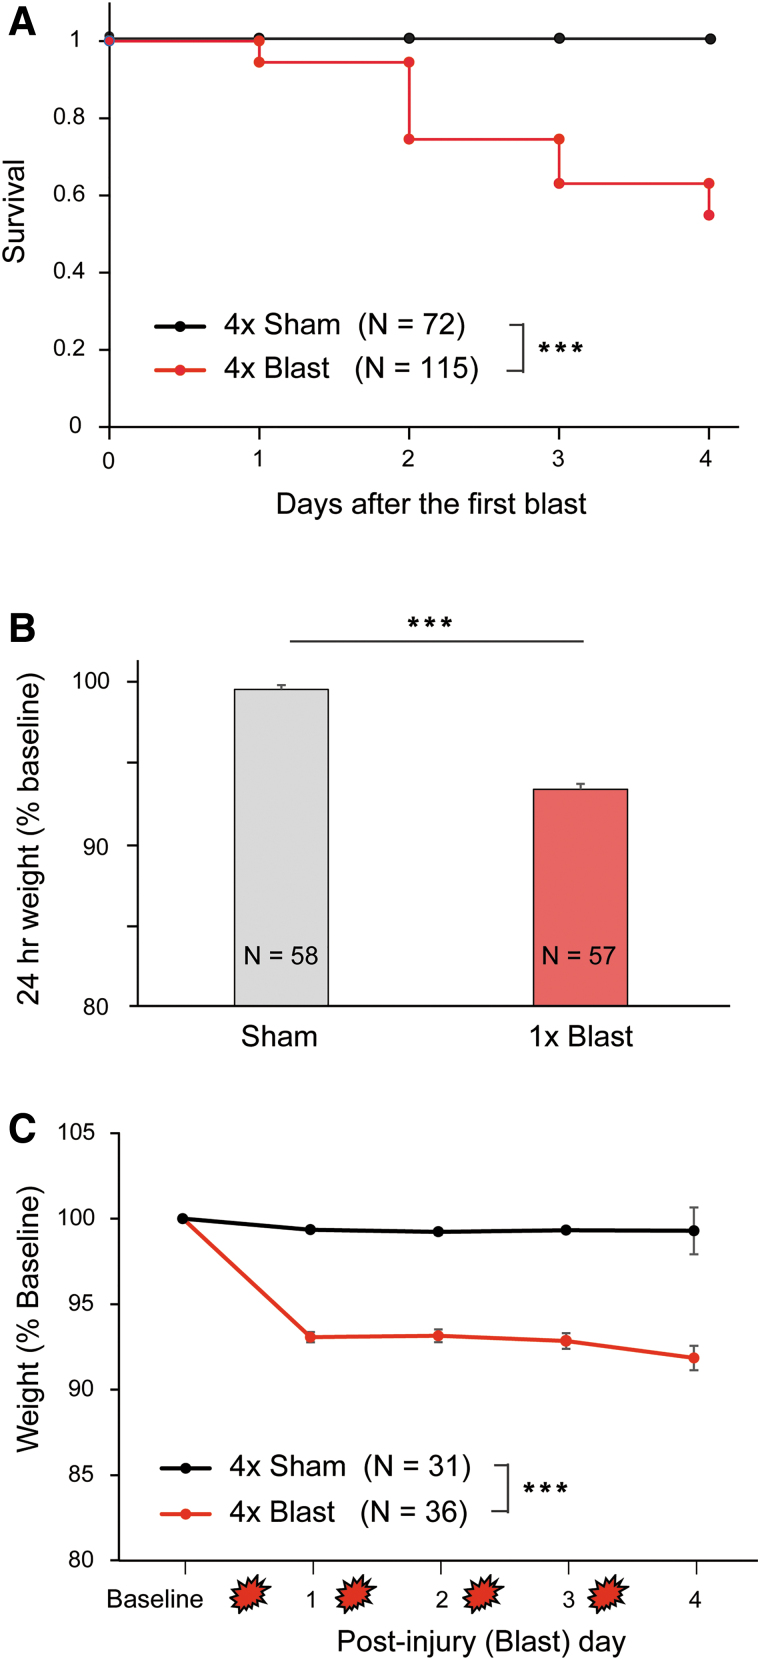
FIG. 2.
Survival rates and body weight changes after blast. (A) Percentage of animals that survived after repeated exposures to blast. No animals expired from 1 × or 4 × Sham treatment or after 1 × Blast. n = 72 for 4 × Sham, n = 115 for 4 × Blast. n = 57 for 1 × Sham, and 1 × Blast, data not shown. (B) Body weight change (percentage) after 1 × Sham treatment (n = 58) or 1 × blast (n = 57). Mice that sustained a single blast last weighed ∼6.6% less than pre-blast baseline at 24 h after injury. ***p < 0.001. (C) Body weight changes at baseline and on days 1–4 after blast. The 4 × Blast mice (n = 36) exhibited 7.0–8.2% losses of their body weight, whereas Sham mice (n = 31) remained stable (99.3% of baseline). The graph includes data for mice that survived all blast exposures. ***p < 0.001. Data are mean ± SEM. SEM, standard error of the mean. Color image is available online.

