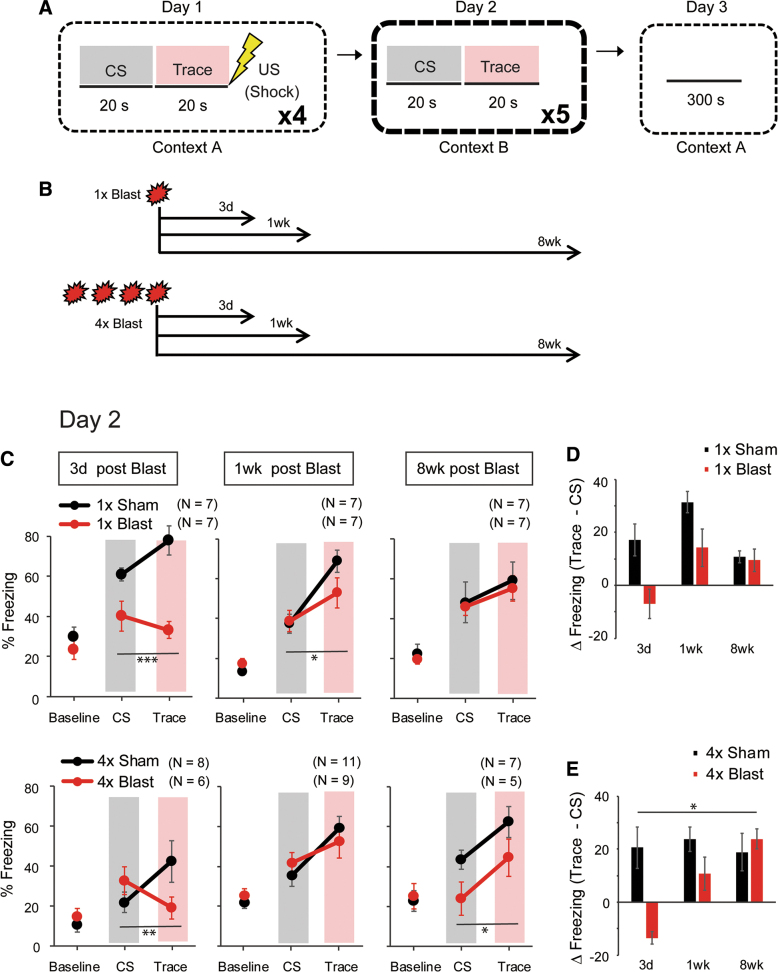
FIG. 5.
bTBI produced abnormalities in trace fear learning. (A) Schematic illustration of the 3-day trace fear conditioning task. The trace period between CS and US was 20 sec. On day 1, there were 4 × CS-trace-US sequences separated by a random interval (150–270 sec) between presentations. On day 2, there was no US; the 20-sec post-CS intervals are indicated as “Trace” periods. (B) Schematic illustration of the timeline of experiments after 1 × Blast and 4 × Blast. (C) Percent freezing during the trace fear retrieval test (day 2). Percent freezing during the pre-CS baseline, CS presentation, and trace period in mice conditioned either 3 days, 1 week, or 8 weeks after 1 × Blast (top row) or 4 × Blast (bottom row). *p < 0.05; **p < 0.01 for blast × test phase interaction. Gray shading indicates CS presentation, and pink shading indicates Trace period. (D,E) Trace and CS freezing differencial [ΔFreezing (trace – CS)], (% freezing during trace – % freezing during CS), are plotted to show the temporal pattern of freezing behavior after 1 × Blast (D) and 4 × Blast (E). *p < 0.05 for blast × post-blast interval interaction. n = 7 for 1 × Sham and n = 7 for 1 × Blast at 3 days, 1 week, and 8 weeks, n = 8 for 4 × Sham and n = 6 for 4 × Blast at 3 days, n = 11 for 4 × Sham and n = 9 for 4 × Blast at 1 week, and n = 7 for 4 × Sham and n = 5 for 4 × Blast at 8 weeks. bTBI, blast traumatic brain injury; CS, conditioned stimulus; US, unconditioned stimulus. Color image is available online.

