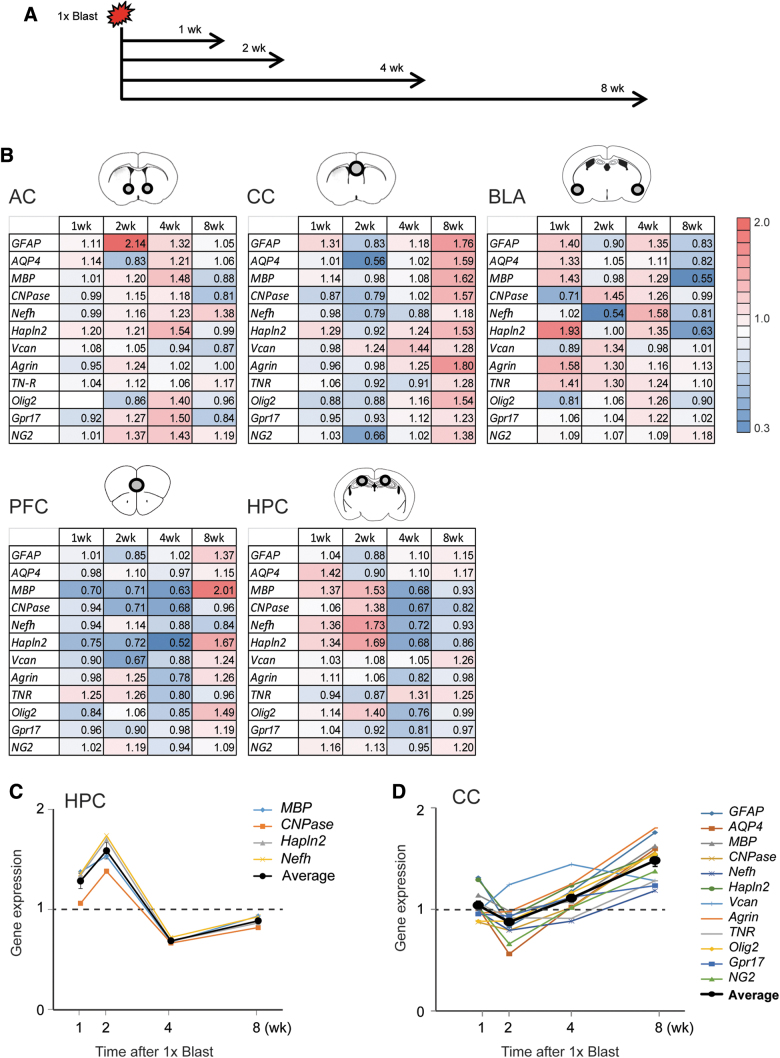
FIG. 7.
bTBI altered hippocampal expression of myelin and nodes of Ranvier-related genes. (A) Timeline of brain tissue dissections after 1 × Blast. (B) RT-qPCR data for anterior commissure (AC), corpus callosum (CC), basolateral amygdala (BLA), pre-frontal cortex (PFC), and hippocampus (HPC). Illustrations of the sampled brain areas are shown as circles within the brain region cartoons at the top of each table. ΔCT values from qPCR (the difference in Ct between target genes and reference genes) were calculated, and the normalized 2-ΔΔCt values (ΔΔCT is a difference in CT between 1 × Blast mice [n = 7] the 1 × Sham group [n = 7]) are shown in a heatmap (cold for values <1.0; warm for values >1.0). (C) Summary of gene expression changes after a single blast for MBP, CNPase, Nefh, and Hapln2 in the hippocampus; thick line indicates the average ± SEM. (D) Summary of expression changes for 12 genes in the corpus callosum after 1 × Blast; thick line indicates the average ± SEM. bTBI, blast traumatic brain injury; CNPase, 2′,3-cyclic nucleotide-3-phosphodiesterase; Ct, cycle threshold; Hapln2, hyaluronan and proteoglycan link protein 2; MBP, myelin basic protein; Nefh, neurofilament heavy chain; qPCR, quantitative polymerase chain reaction; RT-qPCR, reverse-transcription quantitative real-time polymerase chain reaction; SEM, standard error of the mean. Color image is available online.

