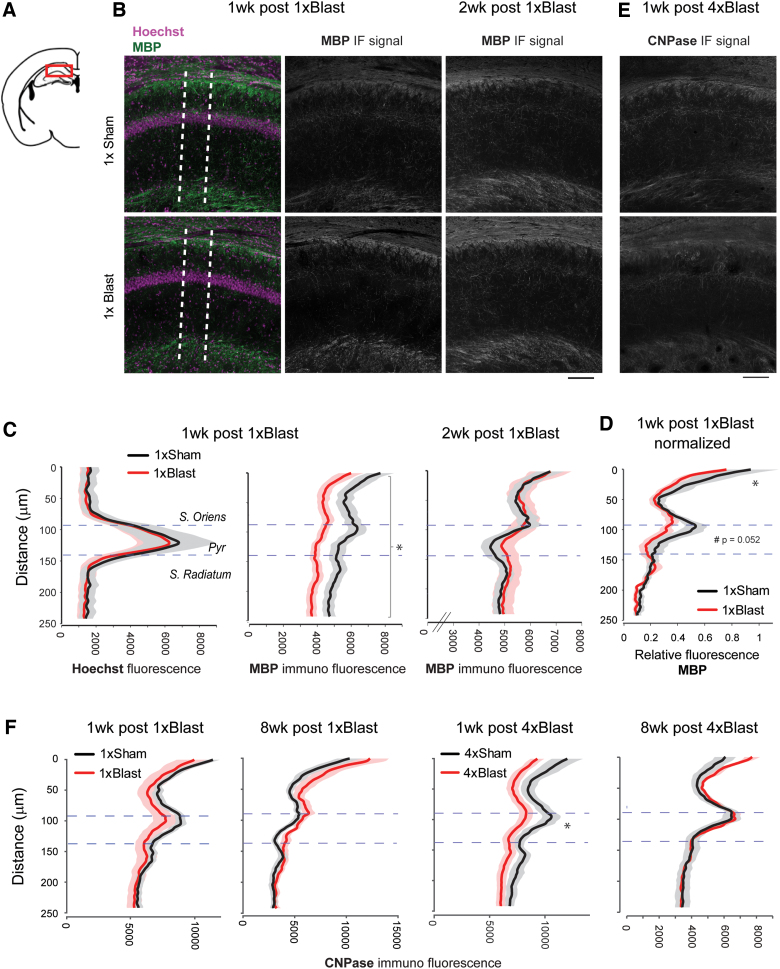
FIG. 8.
bTBI reduced hippocampal protein levels of myelin markers. (A) Illustration of a coronal section (bregma −1.94 mm) containing the HPC CA1 area examined. (B) Representative images of MBP immunostaining images at 1 and 2 weeks after 1 × Blast. Dotted lines indicate an example of the zone (200 μm thick) within which the immunofluorescent signal was analyzed. (C) Quantification of MBP signal intensity at 1 and 2 weeks after 1 × Blast. The intensity curve for Hoechst nuclear staining (left) was used to define the pyramidal cell layer. Dotted horizontal lines represent the pyramidal cell layer. n = 8 for 1 × Sham and n = 8 for 1 × Blast at 1 and 2 weeks. *p < 0.05, main effect of blast. (D) Normalized relative fluorescence of MBP signal for 1 week post 1 × Blast. *p < 0.05; #subthreshold significance. (E) Representative images of CNPase immunostaining images at 1 week after 4 × Blast. (F) Quantification of CNPase immunofluorescence signal intensity at 1 and 8 weeks after 1 × Blast and 4 × Blast. n = 7 for 1 × Sham and n = 7 for 4 × Blast at 1 and 8 weeks. *p < 0.05, blast × layer interaction. Data are mean ± SEM (shade). Scale bar, 100 μm. bTBI, blast traumatic brain injury; CNPase, 2′,3-cyclic nucleotide-3-phosphodiesterase; IF, immunoflourescence; MBP, myelin basic protein; SEM, standard error of the mean. Color image is available online.

