FIG. 9.
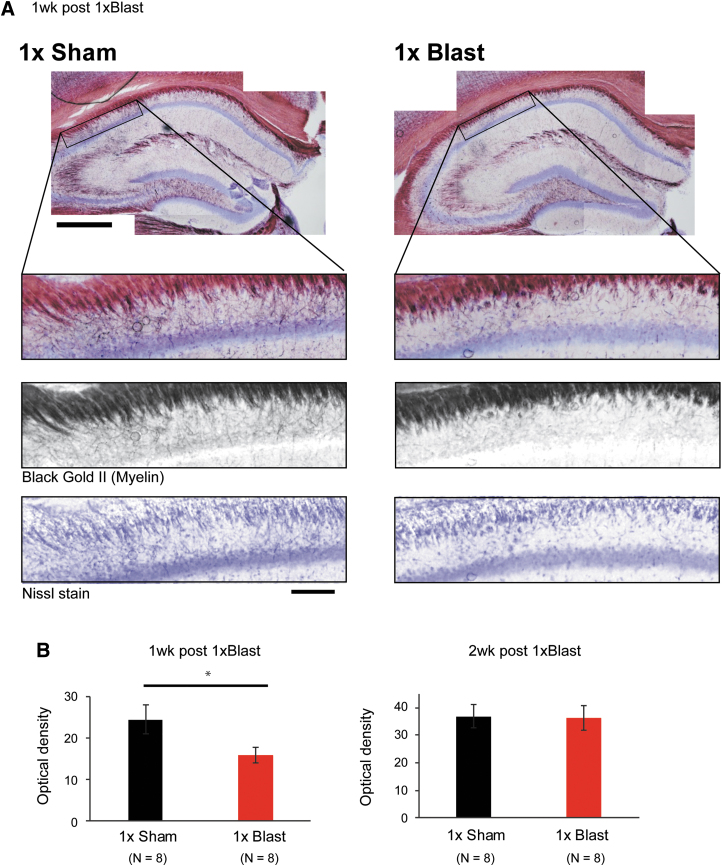
bTBI produced loss of hippocampal myelin. (A) Top: representative image of histological myelin staining using Black Gold II, costained with cresyl violet (Nissl staining), for 1 × Sham and 1 × Blast at 1 week. Scale bar, 500 μm. Black rectangles indicate areas where myelin signals were analyzed. Bottom: magnified view of striatum oriens. From top to bottom: brightfield, Black Gold II, and Nissl stain images, respectively. Scale bar, 100 μm. (B) Quantification of Black Gold II staining intensity in the CA1 striatum oriens revealed reduced myelin in 1 × Blast (n = 8), as compared to 1 × Sham (n = 8) mice at 1 week, but not at 2 weeks, post-blast (n = 8 for 1 × Sham, n = 8 for 1 × Blast). *p < 0.05. Data are mean ± SEM. bTBI, blast traumatic brain injury; CA1, cornu ammonis 1; SEM, standard error of the mean. Color image is available online.

