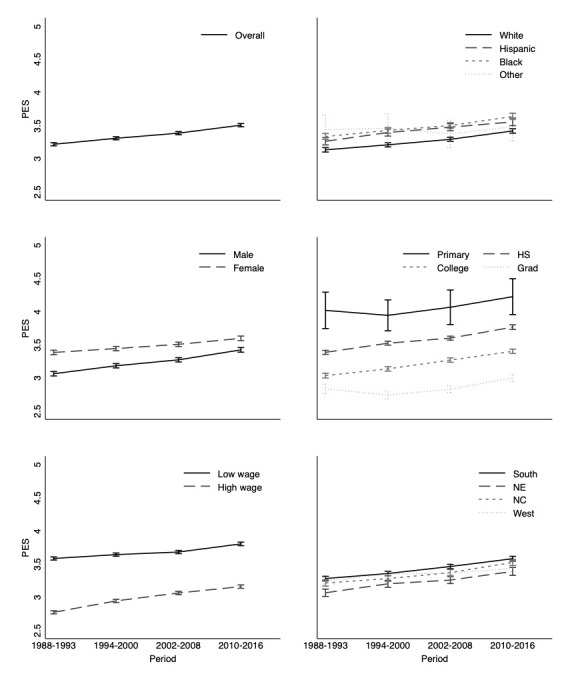
Figure 1.

Precarious employment score over time, 1988-2016.a, b, c [CI=confidence interval; HS=high school; NC=north central; NE=north east; PES=precarious employment score.]
a We estimated the PES using a GEE model and the categorical indicators of time periods. We then predicted the average PES at each time period with their 95%CI.
b Estimates are adjusted to age 30 years.
c Low wage is defined as below the state-year median, high wage is defined as above the state-year median.
