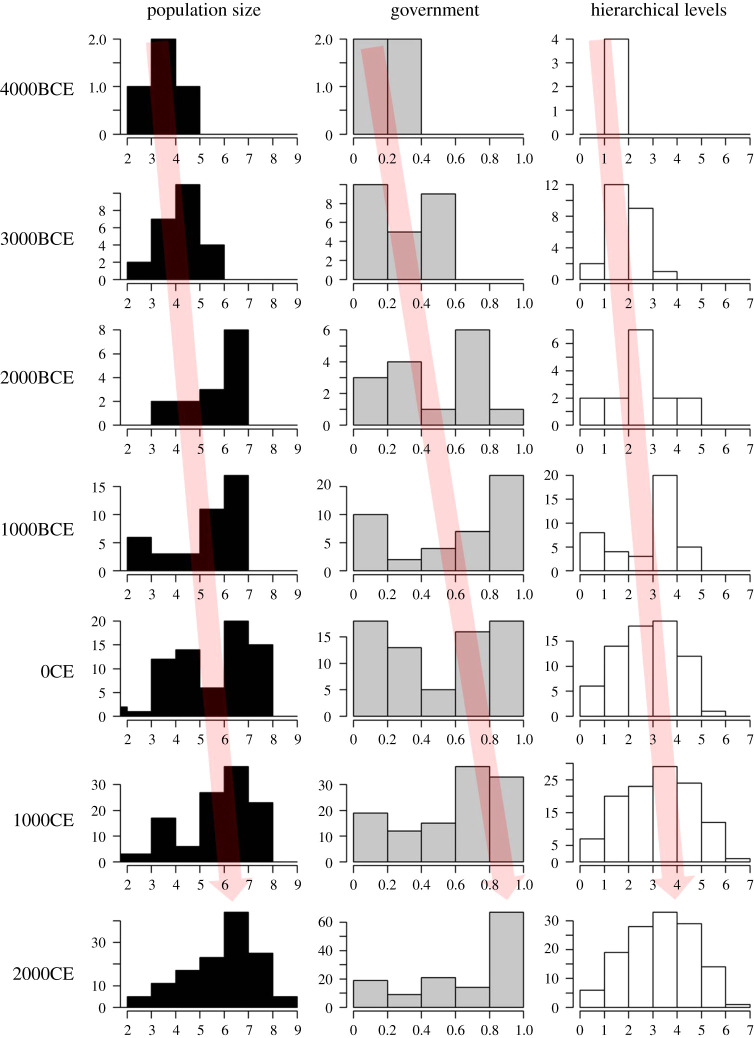
Figure 1.
Population size, governmental roles and hierarchical levels of authority show correlated increases over time, i.e. as societies get bigger they also tend to get more complex in terms governmental and hierarchical institutions. The rows refer to the 1000-year time period prior to the dates indicated on the left. Frequency distributions are calculated based on cases drawn from a global, historical database [39]. x-axis values refer to log10 polity population size (left), governmental roles index (proportional measure, 0: no such roles, 1: maximum possible recorded in sample), mean number of hierarchical levels (see the electronic supplementary material and [39] for details of dataset and measurements). The red arrow highlights the shift in the mode of these distributions towards greater scale and complexity which is indicative of a driven macro-evolutionary trend mechanism, suggesting there is some evolutionary force favouring larger, more complex societies [43] (see text). Note also the reduction in the relative frequency of smallest, least complex societies. (Online version in colour.)

