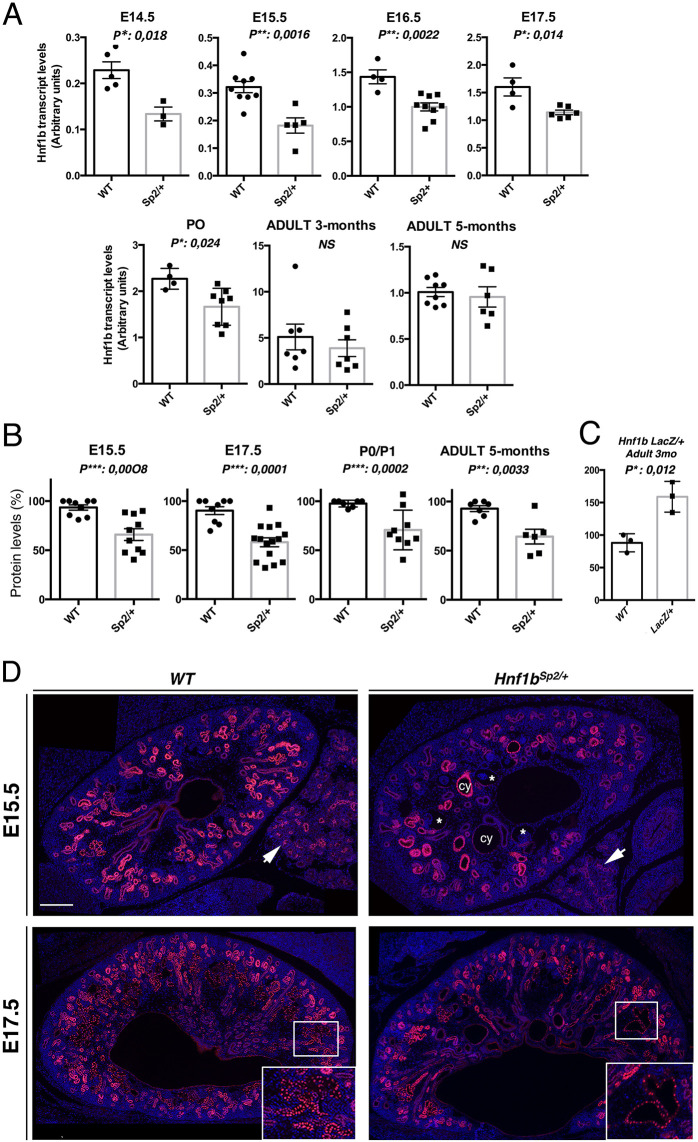
Fig. 1.
Expression levels of normal Hnf1b transcripts and protein from WT and Hnf1Sp2/+ heterozygous mutants. (A) qRT-PCR of normal Hnf1b transcripts in WT and Hnf1bSp2/+ kidneys at the indicated stages. WT versus Hnf1bSp2/+ sample numbers were as follows: E14.5, n=5 vs n=3; E15.5, n=9 vs n=5; E16.5, n=4 vs n=9; E17.5, n=4 vs n=6; P0, n=4 vs n=8; adult 3 months, n=7 vs n=7; adult 5 months, n=8 vs n=6. Significant decreases in Hnf1b transcript relative to WT were at E14.5 (58.5%), E15.5 (57%), E16.5 (50%) and P0 (64%). NS, not significant. (B) Western blot quantification of HNF1B protein levels in Hnf1bSp2/+ relative to WT. Significant decreases to 70%, 62%, 72% and 69% relative to WT were observed at E15.5, E17.5, P0 and 5 months, respectively. (C) Western blot quantification of 3-month-old WT and heterozygous Hnf1bLacZ/+ show a 98% increase in HNF1B levels in the mutants. Error bars represent s.e.m. Unpaired Student's t-test, *P<0.05, **P<0.01, ***P<0.001. (D) HNF1B immunostaining of E15.5 and E17.5 embryo sections show, in Hnf1bSp2/+ kidneys, a global decrease in the number of HNF1B+ structures, together with decreased nuclear staining in some regions (inset in E17.5). Note adjacent pancreatic ducts exhibiting decreased HNF1B expression (arrows), glomerular cysts (asterisks), tubular dilatations (cy) and HNF1B nuclear staining in both non-dilated and dilated renal tubules. Scale bar: 200 μm.

