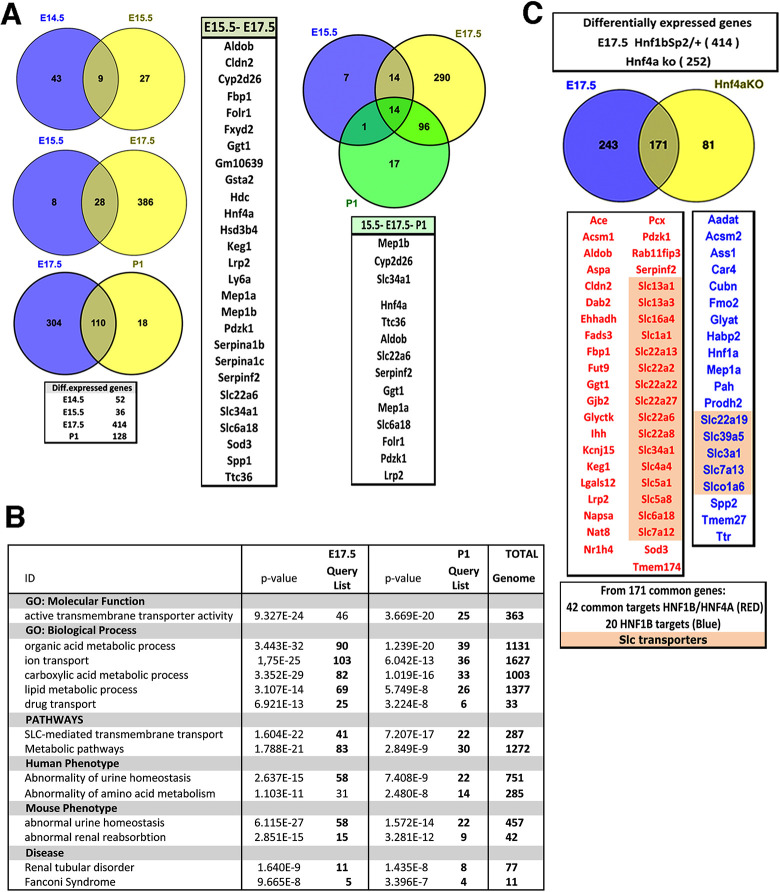
Fig. 6.
Differential expression analysis of Hnf1bSp2/+ mutant versus WT kidneys at different embryonic stages. (A) Venn diagram showing the overlap of genes differentially expressed from E14.5 to P0. (B) Gene ontology (GO) analysis of downregulated genes showing the top enriched terms (Table S4). (C) Venn diagrams show the overlap of differentially expressed genes of E17.5 Hnf1bSp2/+ and P0 Hnf4a knockout (KO) kidneys (Marable et al., 2020). Also indicated are HNF1 and HNF4 common target genes (red) and HNF1 targets (blue).

