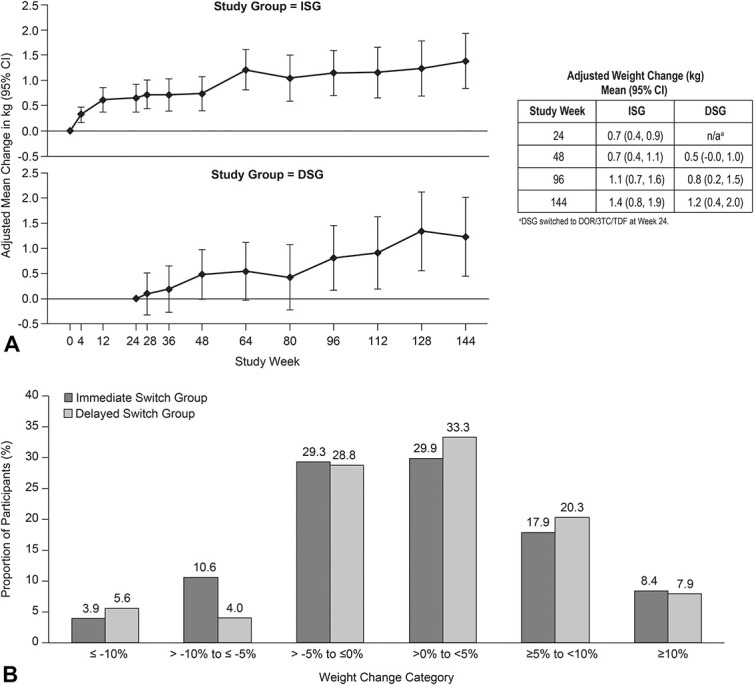
FIGURE 2.

Weight change after switch to DOR/3TC/TDF. A, Mean change (95% CI), adjusted for weight at time of switch, race (Black/non-Black), ethnicity (Hispanic/others), sex, age, previous therapy class, baseline CD4+ T-cell count, and baseline HIV-1 RNA. B, Proportion of participants by percent change in weight at week 144. CI, confidence interval.
