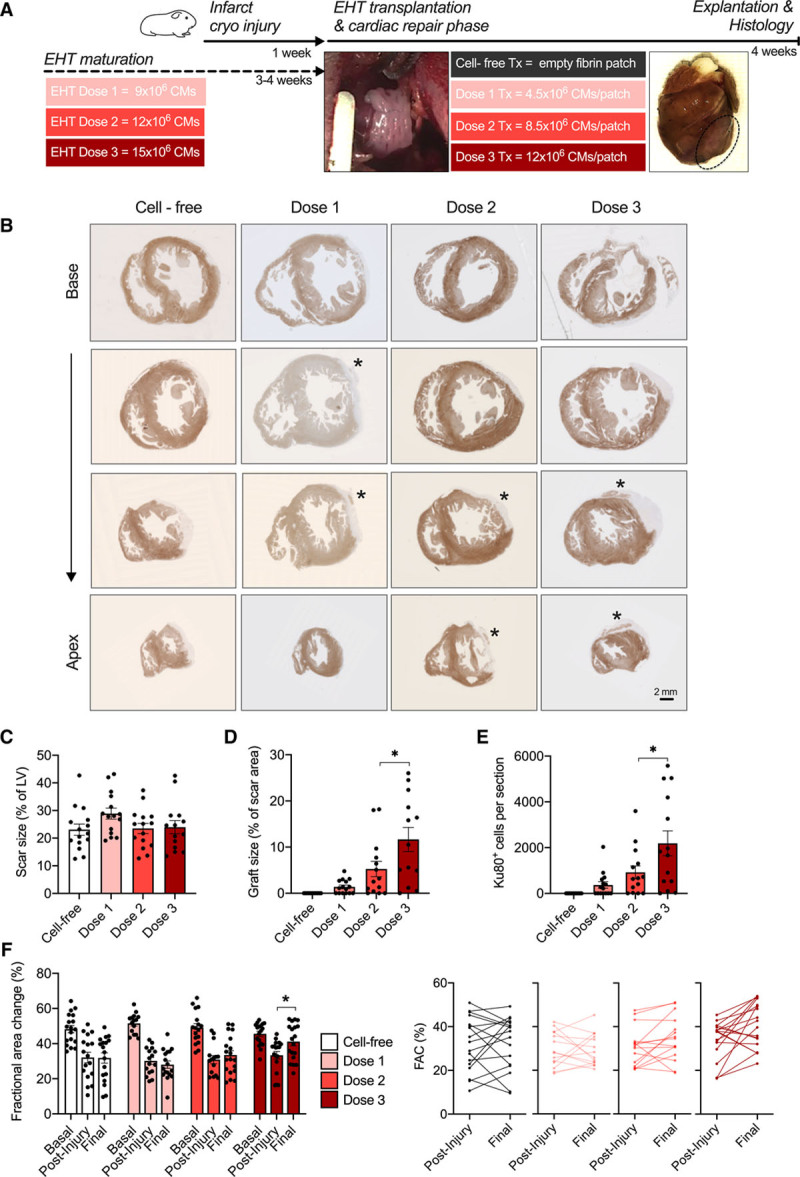
Figure 3.

EHT patch transplantation dose-finding study in a guinea pig cryo-injury model. A, Study design scheme. B, Dystrophin-stained short-axis sections from guinea pig hearts of the respective groups. Asterisks mark human grafts. C, Scar size quantification as percentage of the left ventricle. Quantification of graft size as percentage of scar area (D) and quantification of human Ku80+ cell number per heart section in the respective groups (E) 4 weeks after transplantation (n=14–15; each data point represents 1 heart). Statistical analysis was determined by 1-way ANOVA followed by the Tukey test for multiple comparisons *P<0.05. F, Fractional area change values for baseline, postinjury, and 4 weeks after transplantation (n=19 [dose 1/2/cell-free], n=18 [dose 3]). Differences in fractional area change between postinjury and 4 weeks after transplantation. Statistical analysis was determined by 2-way ANOVA followed by the Tukey test for multiple comparisons. *P<0.05. CMs indicates cardiomyocytes; EHT, engineered heart tissue; FAC, fractional area change; LV, left ventricular tissue; and Tx, transplantation.
