
Figure 6.
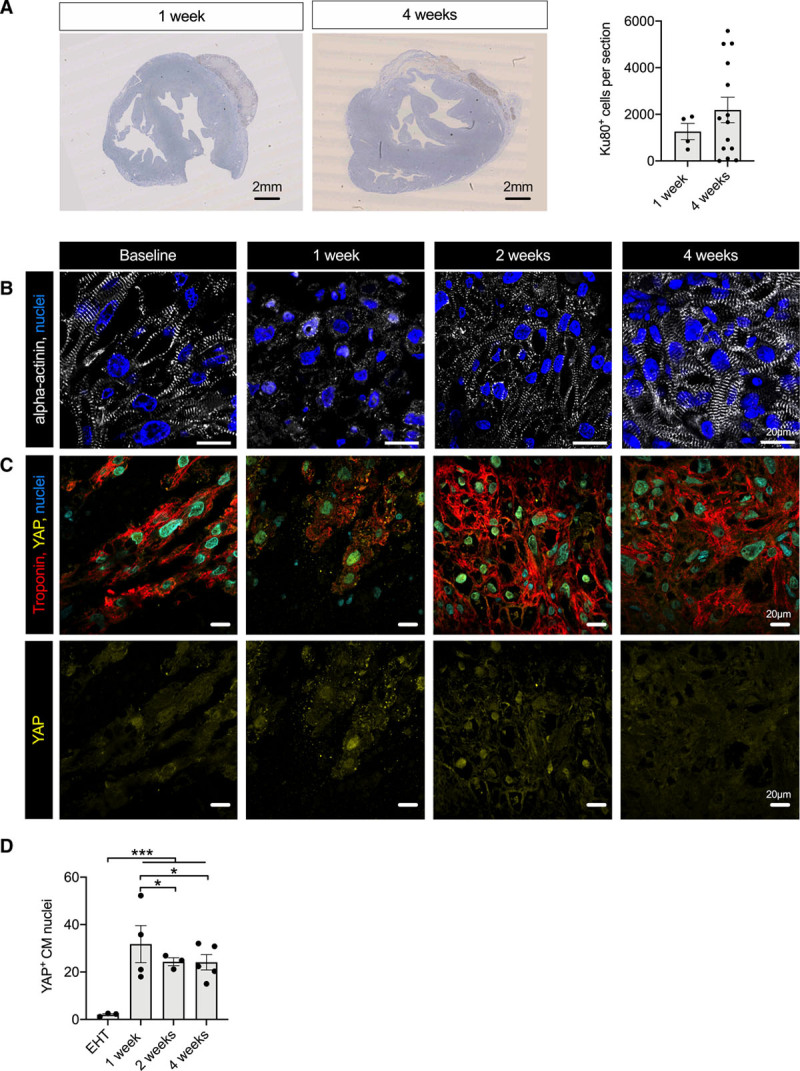
Analysis of graft development after transplantation. A, Human Ku80 staining of guinea pig heart sections 1 and 4 weeks after transplantation and quantification of human Ku80-positive cells at the respective time points (n= 4 hearts 1 week after transplantation and n=14 hearts 4 weeks after transplantation). Statistical analysis was performed by 2-tailed unpaired Student t test. Mean±SEM values are shown. B, α-Actinin staining of EHT (baseline) and human grafts 1 week, 2 weeks, and 4 weeks after transplantation. YAP staining (C) and quantification (D) of nuclear YAP in EHT patches (baseline) and human grafts 1, 2, and 4 weeks after transplantation (n=300 nuclei/N=3–5 EHT patches or hearts, each data point shows 1 EHT patch or heart). Statistical analyses were performed by 1-way ANOVA followed by Tukey test for multiple comparisons. Mean±SEM values are shown, *P<0.05, ***P<0.001. CM indicates cardiomyocyte; EHT, engineered heart tissue; and YAP, yes-associated protein.