Figure 1.
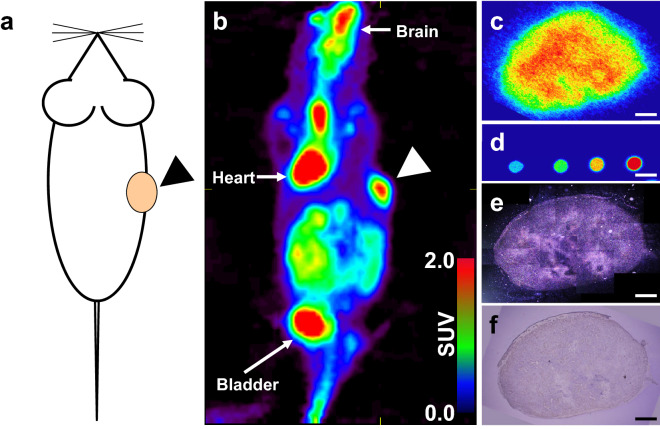
Multi-modal imaging of 18F-FDG distribution in the A431 cell-derived tumor. (a) Illustration of tumor xenograft mouse. The arrow-head shows the location of the A431 cell-derived tumor. (b) Imaging to visualize tumor tissues using 18F-fluorodeoxyglucose positron emission tomography (18F-FDG PET) coronal view image of the A431 xenograft SCID mouse. The arrow-head shows the A431 cell-derived tumor. (c) Macro-autoradiography of an A431 cell-derived tumor section. (d) Macro-autoradiography of diluted dosage. The spots show 1 μL of 1:200-, 1:400-, 1:800-, and 1:1600-diluted injected dosages, from right to left. (e) The tiling image of micro-autoradiographs of a whole section adjacent to (c) in dark field observation. (f) HE staining of an adjacent section of (c). Bars: 1000 μm.

