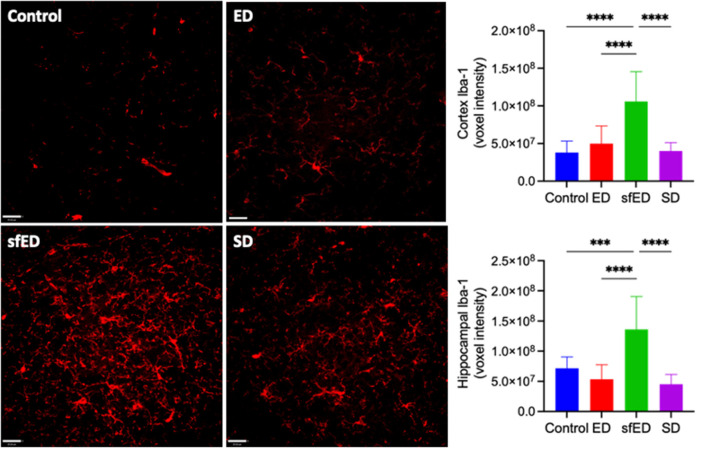
Figure 2.
Neuroinflammatory measures. Twenty μm sections of brain tissue for each treatment group were stained for Iba-1 (red) and measured under a confocal fluorescent microscope. A representative image of each group is shown for both stains at low power magnification (20x) (scale bar = 20 μm). All measures are of voxel intensity and therefore render the data to show relative levels rather than absolute concentrations. Statistical analysis was performed using one way ANOVA with Fisher's LSD post-hoc analysis (n = 10; ***p < 0.0005; ****p < 0.0001).

