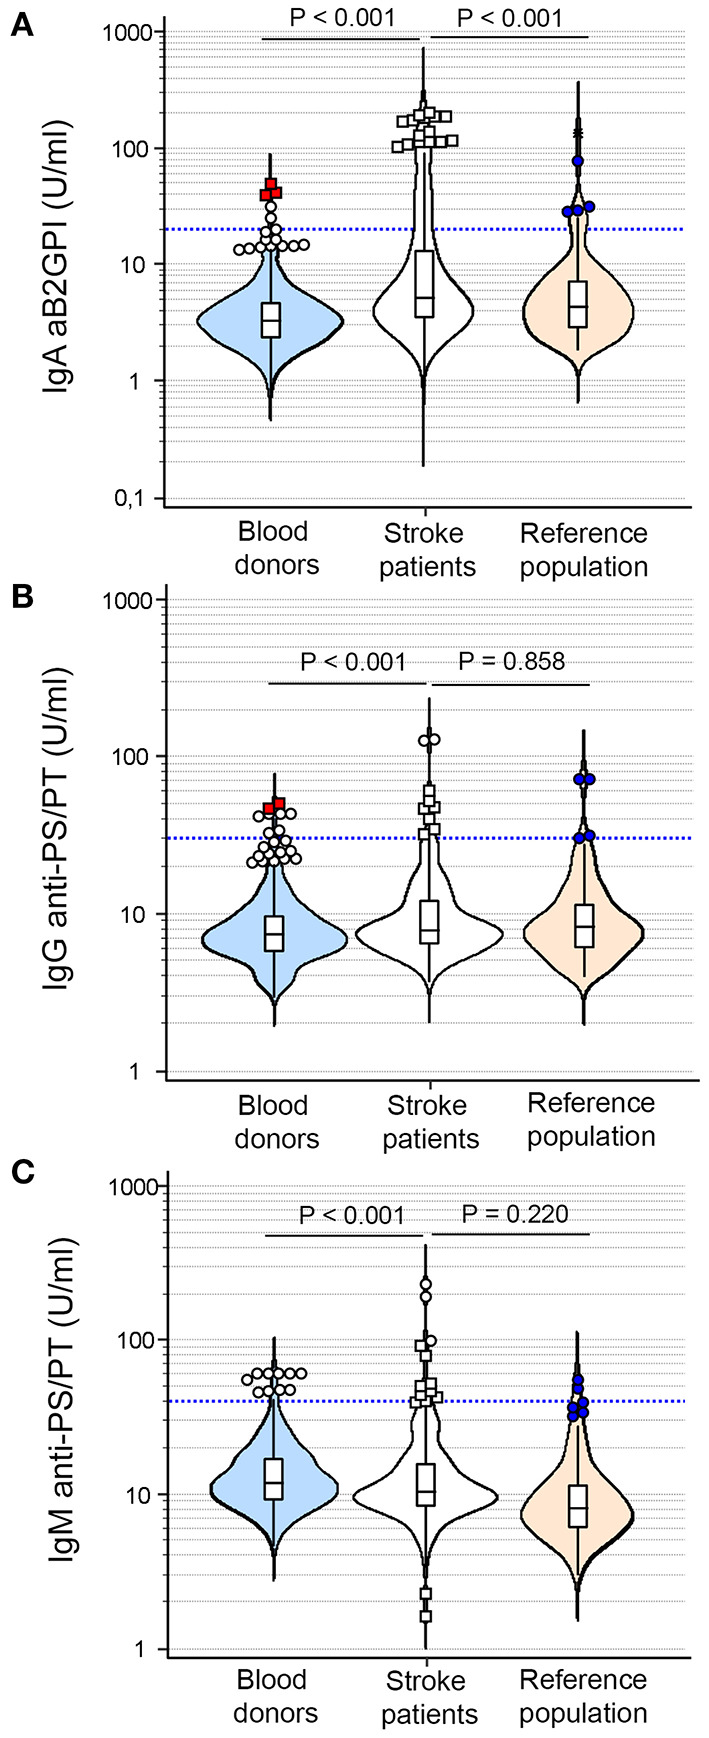
Figure 2.

Distribution of extra-criteria aPL levels in blood donors (blue), stroke patients (white), and reference population (orange). (A) IgA anti-b2-glycoprotein-I antibodies. (B) IgG anti-phosphatidylserine/prothrombin antibodies. (C) IgM anti-phosphatidylserine/prothrombin antibodies. The cut-off of each antibody is represented by the blue lines.
