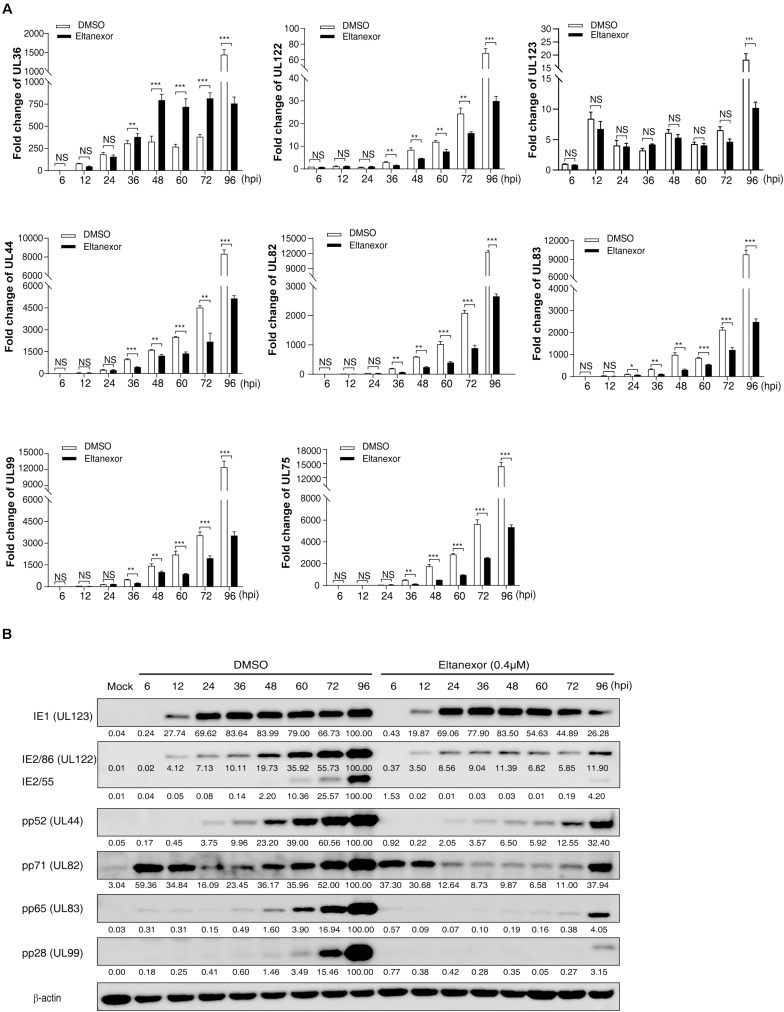
FIGURE 3.
Transcript and protein levels of HCMV are suppressed by Eltanexor treatment in HFFs. (A) Transcript levels of HCMV IE genes (UL36, UL122, and UL123), E gene (UL44), and L genes (UL82, UL83, UL99 and UL75) were quantified by RT-qPCR at the indicated time points. HFFs were infected with HCMV at a MOI = 1 and then treated with Eltanexor (0.4 μM) or DMSO. The levels of viral transcripts at the indicated time points were determined by RT-qPCR. Fold changes of viral transcripts were normalized to the internal control β-actin. Fold changes of viral transcripts in HCMV infected cells at 6 hpi were further normalized to 1 (arbitrary unit). Data represent mean ± SEM, n = 3, *p < 0.05, **p < 0.01, ***p < 0.001. (B) protein levels of IE, E, and L genes were measured by Western-blotting at the indicated time points. Cell lysates were collected at the indicated time points as described in (A) and immunoblotted with antibodies against viral IE proteins (IE1 and IE2, encoded by UL123 and UL122), viral E protein (pp52, encoded by UL44), and viral L proteins (pp71, pp65, and pp28, encoded by UL82, UL83, and UL99). β-action served as the loading control. Viral protein band intensities were analyzed by Amersham Imager 600 analysis software. The experiments were repeated three times.

