
Figure 4. The frequency and density of monocyte TSPO surface expression increases with LPS stimulation and is not due to cell death.
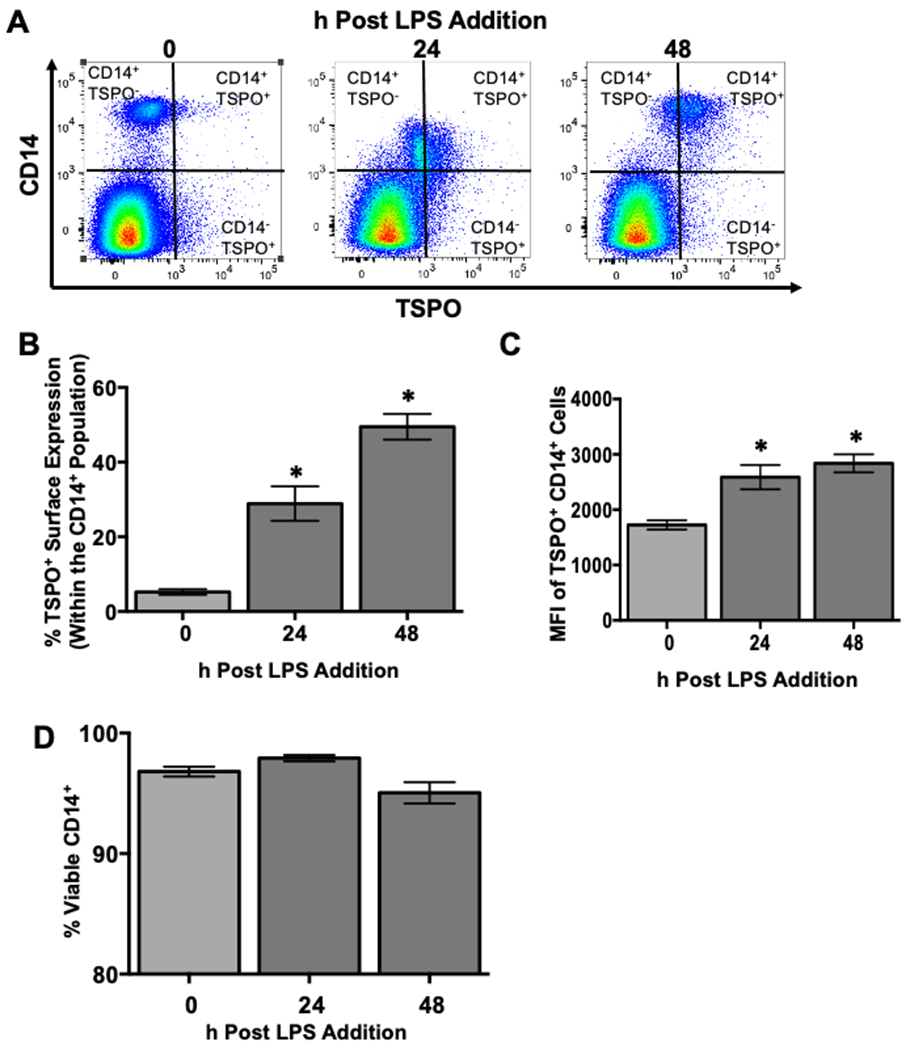
To determine if monocyte TSPO surface expression increased over the course of the 48 hour activation period on a per cell basis and whether this increase corresponded with increased cell death, human PBMC were isolated and treated with 10μg/mL LPS. At the indicated time points, cells were collected and stained extracellularly for CD14 and TSPO followed by incubation with a cell viability dye. (A) Representative flow plots for CD14 and TSPO surface expression. (B) Average change in the percentage of monocytes with TSPO surface expression following LPS activation. (C) Average change in surface TSPO (mean fluorescence intensity). (D) Monocyte cell viability was calculated by subtracting the frequency of live cells from the total to yield a viability percentage. Results are from 2 independent experiments assessing a total of 6 human donors. * indicate significant differences at the p <0.05 level when compared to time 0 as determined by a one-way ANOVA using a Dunnett’s multiple comparisons post-test. Values are mean ± SEM.