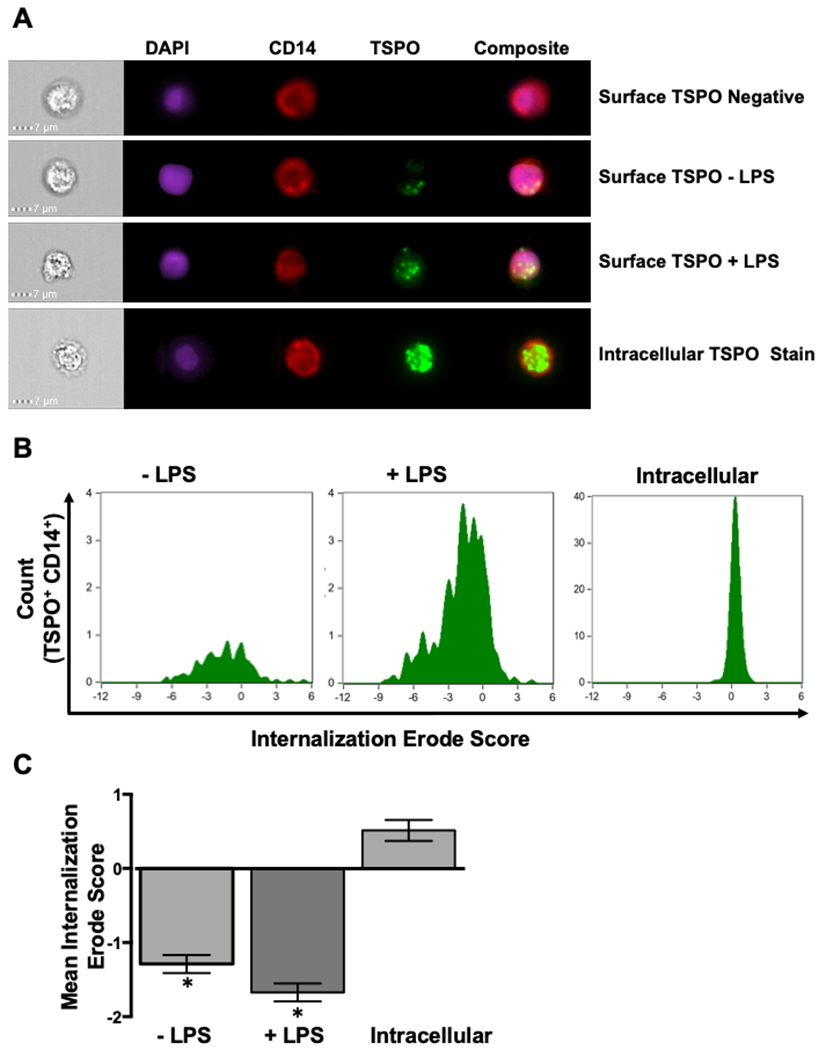
Figure 6. TSPO surface expression is punctate on monocytes following LPS activation and the use of flow imaging software confirms surface localization.

Given that this is one of the first reports of TSPO surface expression on immune cells, we wanted to determine the pattern of TSPO surface expression and verify in an unbiased manner that TSPO was being expressed on the cell surface. To accomplish this, human PBMC were isolated and treated with LPS as described previously. Following 24 hours of activation, cells were collected and stained for surface CD14, surface TSPO, intracellular TSPO and counter stained with DAPI to identify cell nuclei. Cells were then run on a Mark 4 AMNIS flow cytometer to generate single cell IFA images and analyzed using the IDEAS software to calculate TSPO surface expression from a series of cell images. (A) Representative IFA images. (B) Representative histograms of Internalization/Erode score for a given donor. (C) Averaged values of the Internalization/Erode score. * indicate significant differences at the p <0.05 level compared to the intracellular stain as determined by a one-way ANOVA with a Tukey’s multiple comparisons post-test. Values are mean ± SEM. Images were collected from N=3 different individual donors.
