. 2021 Jun 5;31(6):387–391. doi: 10.2188/jea.JE20200625

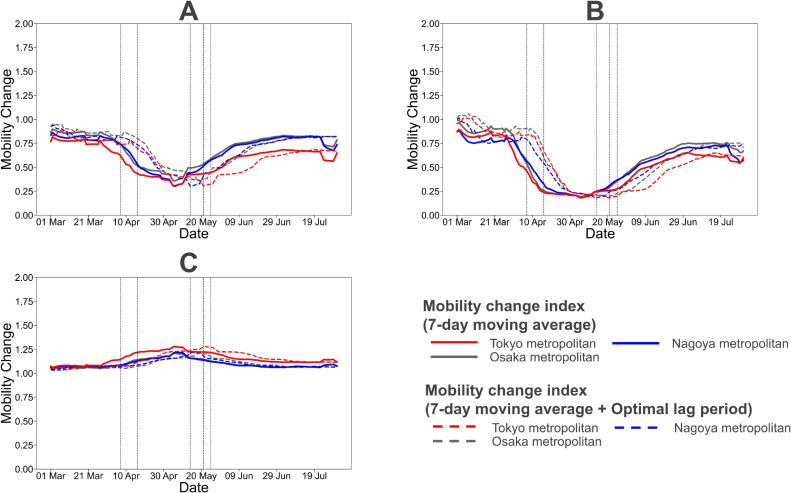
Figure 2. Daily change of mobility in workplaces (A), nightlife places (B), and residential places (C). The solid and dashed lines represent the 7-day moving average of the mobility change index and the 7-day moving average of the mobility change index delayed by the optimal lag period, respectively. The mobility change index is represented by the ratio of the population of each place at specific times (workplaces: 2:00 PM–4:59 PM, nightlife places: 8:00 PM–10:59 PM, residential places: 3:00 AM–5:59 AM) to the baseline population. The baseline in each place was defined based on the median of population at corresponding time of each day from January 3, 2020 to February 6, 2020. The optimal lag period was determined using AIC. Vertical dash lines represent the start/end date of state of emergency (SOE) declaration. (On April 7, 2020, SOE declaration for Tokyo, Osaka, Kanagawa, Saitama, Chiba, Hyogo, and Fukuoka; on April 16, 2020, SOE declaration for the remaining prefectures; on May 14, 2020, lifting of SOE declaration for prefectures excluding the ones in Hokkaido, Tokyo, and Osaka metropolitan areas; on May 21, 2020, lifting of SOE declaration for Kyoto, Osaka, and Hyogo; on May 25, 2020, lifting of SOE declaration for Hokkaido, Saitama, Chiba, Tokyo, and Kanagawa.).

Figure 2.