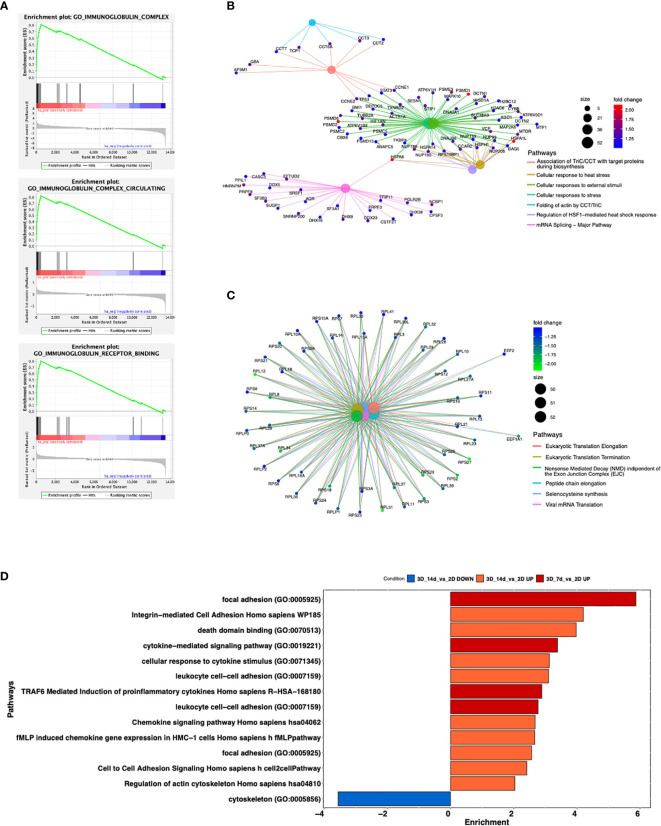
Figure 5.
Enrichment analysis of significantly modulated genes enriching different pathways. (A) GSEA curves for the first most significantly up-regulated pathways for Gene Ontology database in the comparison 3D_7d_vs_2D. (B, C) Cnetplots highlighting up-regulated (B) and down-regulated (C) pathways between the comparisons 3D_7d_vs_2D. (D) Bar plot showing most modulated pathways in both comparisons 3D_7d_vs_2D and 3D_14d_vs_2D.

