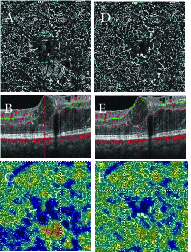
Figure 4.

Enface OCTA, structural OCT and vessel density map of deep capillary plexus in a subject with diabetic macular edema, before (A–C) and after (D–F) segmentation correction at inner plexiform layer (green line) and outer plexiform layer (red line). Note a significant change in Enface OCTA and vessel density map following segmentation correction.
