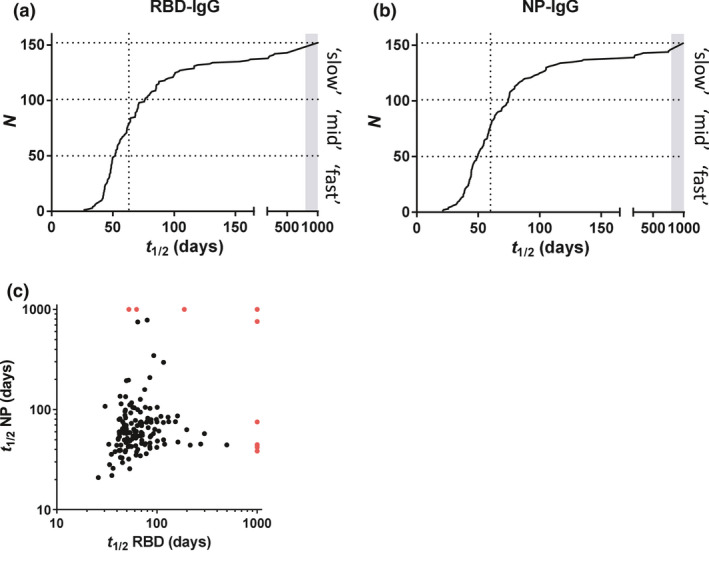
Figure 2.

Regression analysis of IgG levels. For both (a) RBD IgG and (b) NP IgG, data of period 1 were modelled using a mixed‐effects model (log‐linear in IgG; random intercept and slope, time as fixed variable). Slopes of IgG decay in time (see Figure 1) were converted into half‐lives. Dotted vertical lines indicate median half‐lives. Boundaries between ‘slow’, ‘mid’ and ‘fast’ (used to stratify data in Figure 1) are 50 and 76 days, and 48 and 73 days for RBD and NP, respectively. (c) The correlation between estimated half‐lives for anti‐RBD IgG and anti‐NP IgG levels was evaluated by Spearman's rank test (r = 0.23, P = 0.0037). In case of rising levels, t was arbitrarily assigned a value of 1000 in the above images (indicated by the grey bar (a, b) and red dots (c), respectively).
