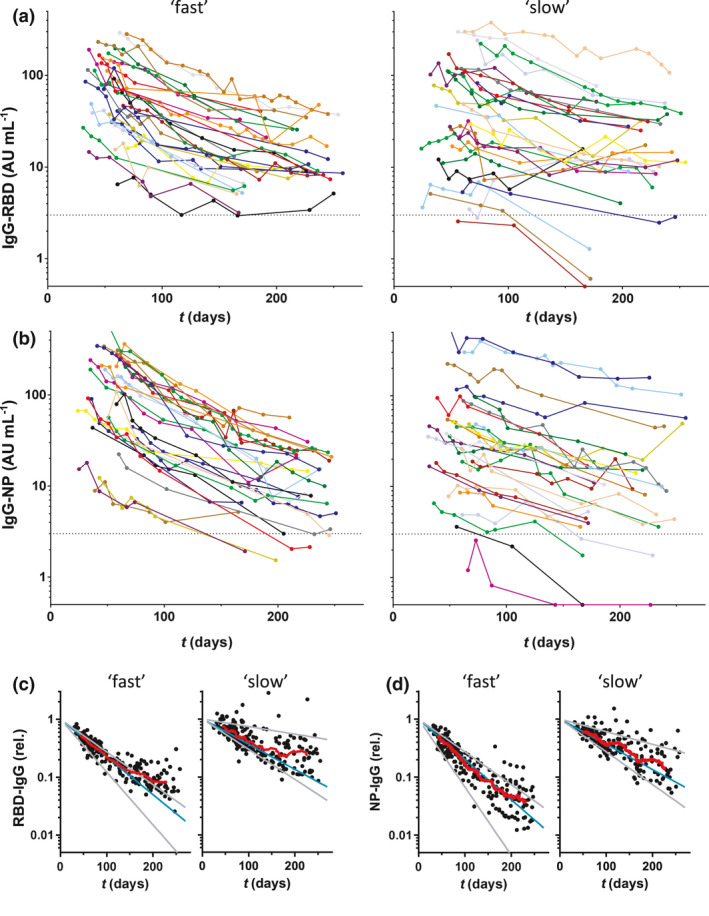
Figure 3.

Dynamic changes in IgG antibodies against SARS‐CoV‐2 during extended follow‐up up to 250 days (period 2). Concentrations of (a) IgG anti‐RBD and (b) anti‐NP plotted in days after onset of disease symptoms (430 samples from 55 donors; mean of 2 independent replicates). Left panels, 28 donors with the fastest decline during period 1, and right panels, the slowest 27 donors, and the boundary between ‘fast’ and ‘slow’ was 56 and 55 days for RBD and NP, respectively. (c, d) Same data but normalised per donor using fitted intercepts from regression analysis of period 1. Blue and grey lines indicate median, smallest and largest fitted slopes from the same analysis (excluding positive slopes, 2 for RBD and 1 for NP) within both groups. Red lines are running averages showing an overall trend within both groups of donors.
