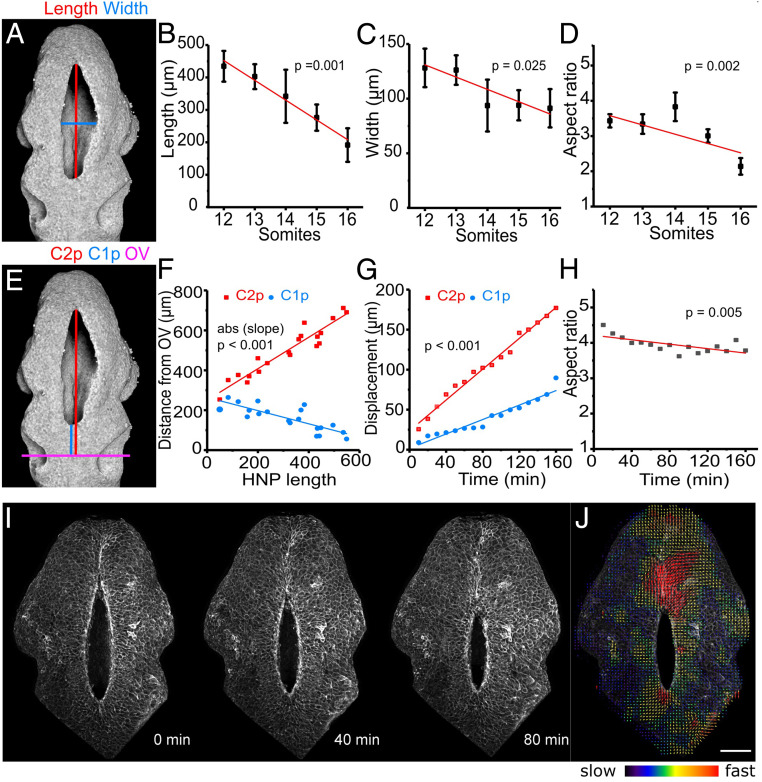
Fig. 2.
HNP closure progresses faster in the caudal than in the rostral direction, while HNP shape remains elliptical. (A) Three-dimensional reconstruction of a representative early (14 somite) HNP reflection image. The red and blue lines indicate HNP length and width, respectively. (B–D) Quantification of HNP length (B), width (C), and aspect ratio (D) in fixed embryos at the indicated somite stages (n = 40). The HNP shortens and narrows as it closes, but it maintains an aspect ratio greater than 2. In all cases, the slope is significantly different from 0 (P < 0.05, ANOVA). (E) Same image as in A. The magenta line shows the mid otic vesicle (OV) level. The red and blue lines show the distance of C2z progression (C2p) and C1z progression (C1p) from mid OV, respectively. (F) Quantification of the distances shown in E against HNP length in fixed embryos (n = 20). The absolute slopes of the regression lines are significantly different from one another. P < 0.001, F-test. (G) Quantification of C2p and C1p (displacement from T = 0, not the mid-OV level) over time in a live-imaged embryo (shown in I). The slopes of the regression lines are significantly different from one another. P < 0.001, F-test. (H) Quantification of HNP aspect ratio over time in the same live-imaged embryo (I). The HNP maintains a highly elliptical shape throughout closure. P indicates the slope is significantly different from 0. (I) Snapshots of a live-imaged mTmG mouse embryo at the time points indicated (14 somites at first frame). (J) Particle image velocimetry illustrating increased cell speed at C1z and C2z. (Scale bar, 100 μm.)

