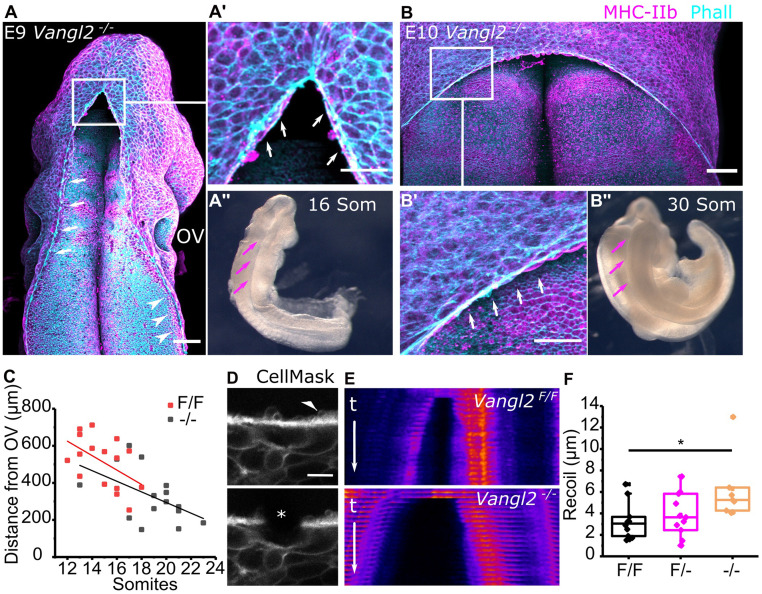
Fig. 3.
Progression of HNP closure from Closure 2 is independent of Closure 1. (A–A’’) Representative whole-mount staining and corresponding bright-field image of an early Vangl2−/− embryo (16 somites [Som]). Annotated are the actomyosin cables and associated ruffles extending along the open hindbrain (white arrows in A and A’) and spinal region (white arrowheads in A). Magenta arrows indicate the open neural folds in bright field (A’’). (Scale bar, 100 μm.) (B–B’’) Representative whole-mount staining and corresponding bright-field image of a late Vangl2−/− embryo (30 Som). Annotated are the actomyosin cables and associated ruffles extending along the open hindbrain (white arrows in B’). Magenta arrows indicate the open neural folds in bright field (B’’). (Scale bar, 100 μm.) (C) Quantification of the distance between the C2z and the mid otic vesicle (OV) level in Vangl2−/− and Vangl2F/F (control) embryos at the indicated somite stages. The OV level was defined as in Fig. 2E. (D) Representative laser ablation of cable-associated cell borders near the C2z. The asterisk shows the ablated border. The white arrowhead points at membrane ruffles, which colocalize with the cable (Fig. 1G). (Scale bar, 10 μm.) (E) Representative kymographs of cable ablations in Vangl2F/F and Vangl2−/− embryos. t indicates timeframes postablation (<1 s/timeframe) and is the same for both kymographs. (F) Recoil quantification after cable ablations in Vangl2F/F (n = 10), Vangl2F/− (n = 11), and Vangl2−/− (n = 7) at 12 to 17 Som stages. P < 0.05, ANOVA with Bonferroni post hoc correction.

