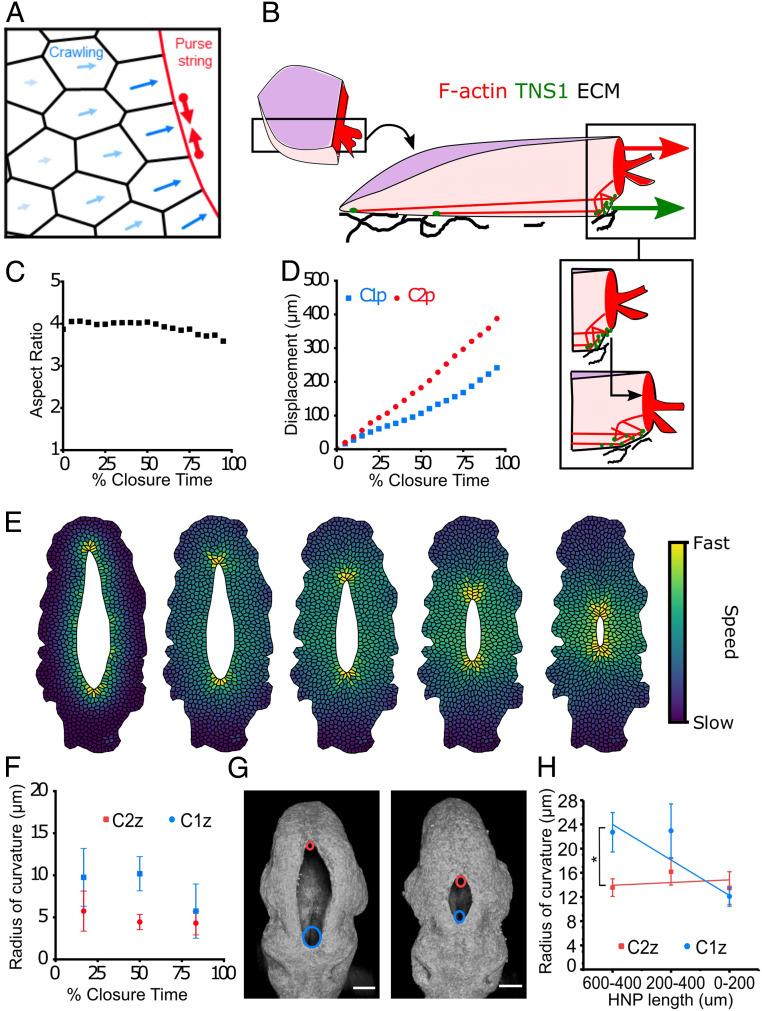
Fig. 5.
Cell-based modeling reveals that asymmetric geometry regulates closure rate asymmetry. (A) Schematic of the vertex model for HNP gap closure. Cell edges on the gap, highlighted in red, have an increased tension because of the assembly of actomyosin purse string. Cells actively crawl toward the gap but with less speed as distance to the gap increases (blue arrows). (B) Schematic representation of the proposed force-generating mechanisms employed by surface ectoderm cells at the HNP gap. These cells assemble F-actin at their leading-edge, purse-string membrane ruffles and stress fiber-like arrangements basally. The early focal adhesion marker TNS1 localizes in basal puncta and is enriched directly behind the purse string. Gap-directed forces are produced by purse-string contractility (red arrow) and displacement onto newly assembled ECM (“crawling,” green arrow). The bottom inset illustrates how purse-string contraction and crawling are proposed to occur. As the purse string pulls the leading edge forward (black arrow), TNS1-positive adhesions accumulate behind it, where they are able to bind to and facilitate the assembly of ECM. (C) Gap aspect ratio against percentage closure time, as outputs of the model combining purse-string contraction and cell crawling. (D) Progression of C1z and C2z against percentage closure time, as outputs of the model. (E) Time course of simulated gap closure, at 10, 30, 50, 70, and 90% of closure time, from left to right. Cell color indicates cell speed. (F) Simulation mean radius of curvature at the C1z and C2z. Data are binned into the nearest tertile of closure. Error bars represent SD within bins (n = 56). (G) Three-dimensional reconstructions of representative early (14 somites, Left) and late (16 somites, Right) HNPs. A circle was fitted at each zippering point to calculate the radius of curvature. Cyan and red circles annotate C1z and C2z, respectively. (H) Experimental mean radius of curvature at the C1z and C2z plotted against HNP length. Error bars represent SE (n = 14 to 17 for each bin). P < 0.05, paired t test.

