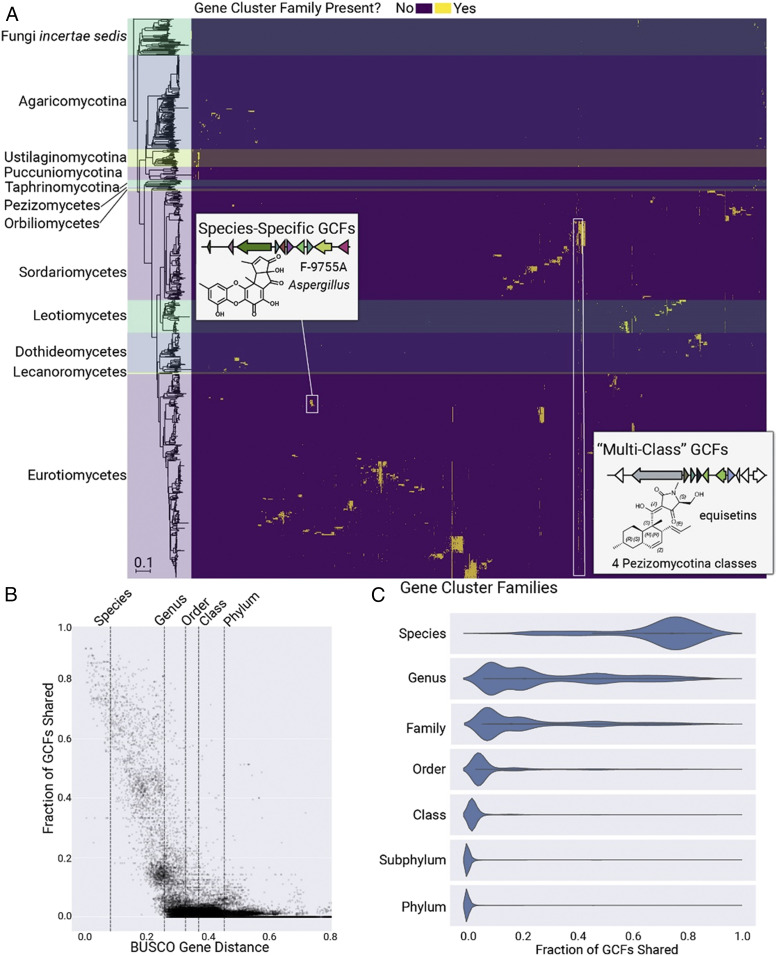
Fig. 2.
The distribution of 12,067 GCFs across the fungal kingdom. (A) Heatmap of GCFs across Fungi. The phylogram to the left shows a Neighbor Joining species tree based on 290 shared orthologous genes across 1,037 genomes; horizontal shaded regions across the heatmap correspond to each labeled taxonomic group. The order of GCF columns is the result of hierarchical clustering based on the GCF presence/absence matrix. Across Fungi, the distribution of GCFs largely follows phylogenetic trends, with most GCFs confined to a specific genus or species. (B) Relationship between genetic distance and GCF content. The dotted lines indicate median genetic distance values for organisms within the same species, genus, order, class, or phylum. Each point in the scatterplot represents a pair of genomes and the fraction of the pair’s GCFs that are shared. (C) Relationship between taxonomic rank and shared GCF content across the fungal kingdom. Violin plots show the fraction of GCFs shared between all pairs of organisms within our 1,000-genome dataset, with each pair classified based on the lowest taxonomic rank shared between the two organisms.

