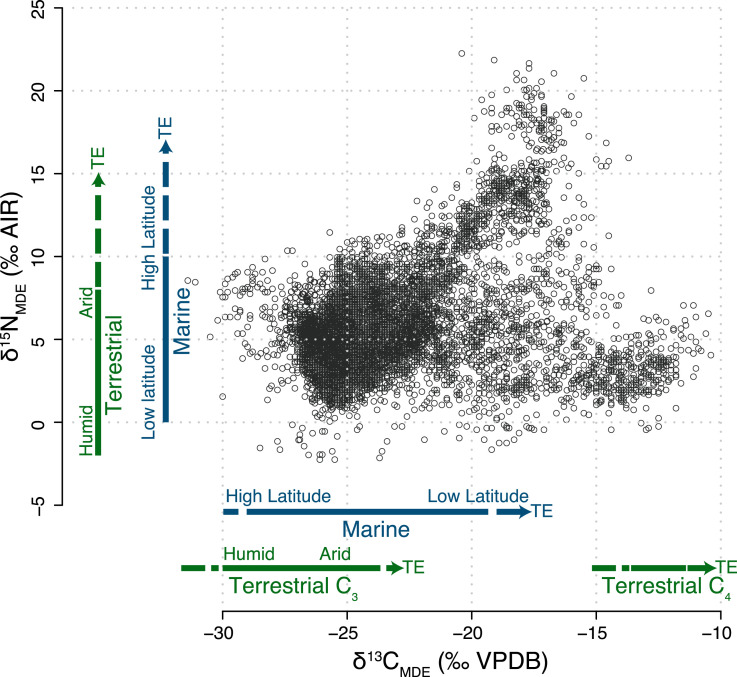
Fig. 2.
Modern diet equivalent data for all PHB individuals (gray points) representing the full dietary spectrum. Terrestrial (green) and Marine (blue) plant/animal δ13CMDE and δ15NMDE ranges are given (solid lines) for comparison. Dashed arrows indicate where tropic enrichment (TE) extends this range to higher values. The marine range for primary production taken from ref. 34 for nitrogen and ref. 35 for carbon. The terrestrial range of values for primary production are also shown for carbon (29, 30, 32, 72) and for nitrogen (27, 29, 31).

