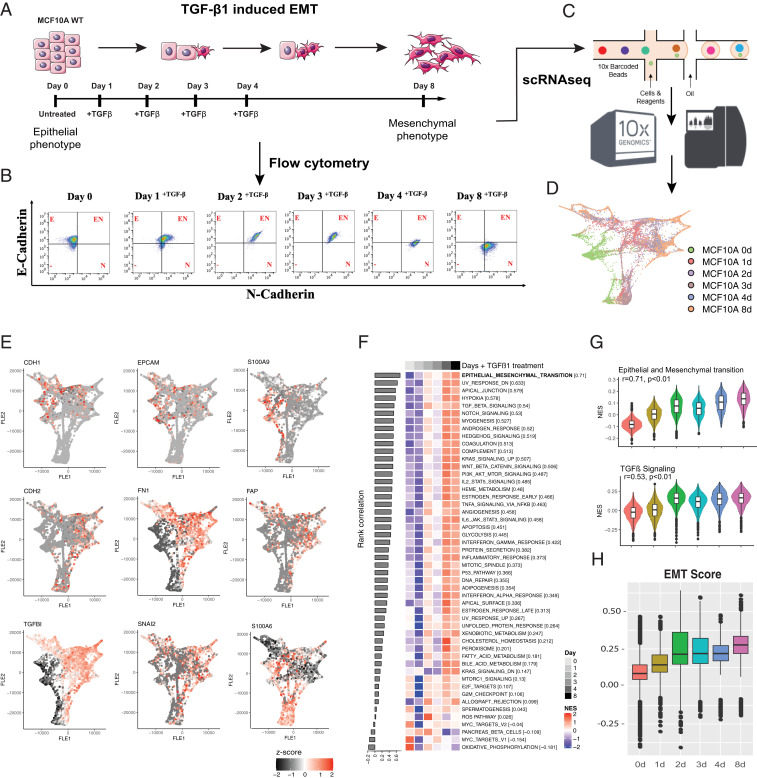
Fig. 1.
During TGF-β1–induced EMT multiple signaling pathways are activated simultaneously. (A) Schematic representation of model used to EMT in MCF10A cells. (B) Flow cytometry analyses of MCF10A cells treated over 8 d with TGF-β. (C) scRNA-seq schematic. (D) Force-directed layout embedding (FLE) of the trajectory of TGF-β1–induced EMT in MCF10A. (E) FLE trajectories of epithelial markers (CDH1, EpCAM, and S100A9), mesenchymal markers (CDH2, FN1, and FAP), and EMT transcription factors (TGFB1, SNAI2, and S100A6) across the time course of TGF-β treatment. (F) Rank correlation of Hallmark signaling pathways. The x axis shows the TGF-β1 time course treatment of MCF10A cells and y axis shows the NES. (G) Violin plot of the hallmark EMT and TGF-β signaling pathways NES for each time point during the TGF-β1 treatment. (H) Kolmogorov–Smirnov EMT scores during TGF-β1 time course treatment of MCF10A cells. ANOVA (***P < 0.001).

