Fig. 3.
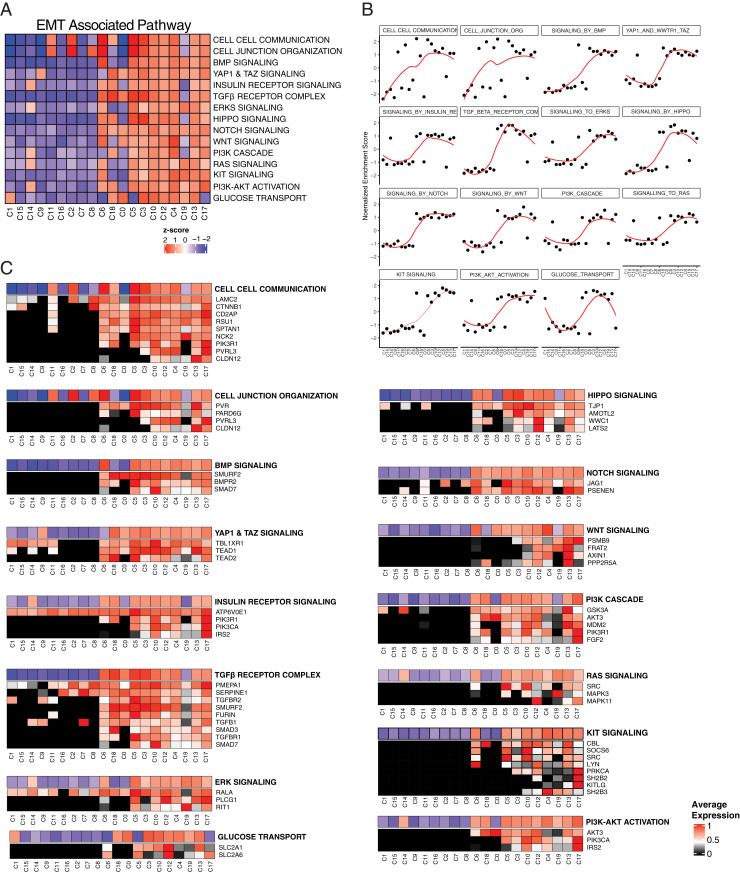
scRNA-seq analysis identifies parallel and sequential signaling pathways involved in TGF-β1–driven EMT. (A) Heatmap of enrichment for indicated EMT-associated pathways in each cluster. (B) NES of significantly altered signaling pathways across pseudotime clusters. The red lines are a fit determined by LOESS. (C) Heatmap showing the distributions of mRNA expression of genes that were induced during TGF-β1–induced EMT and maintained increased expression during EMT progression. Genes associated with each EMT-associated pathway and their fraction in each cluster compared to maximum average expression is shown in alignment with EMT-associated pathway activation.

