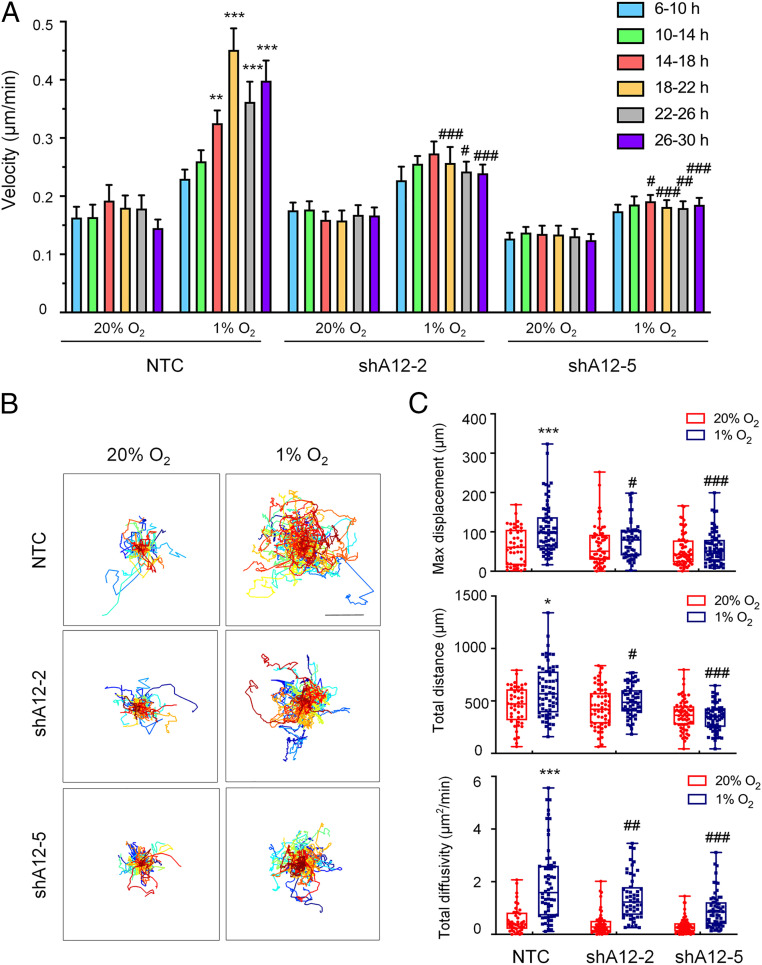
Fig. 3.
ADAM12 knockdown impairs MDA-MB-231 cell motility. (A) Cell velocity over 4-h intervals was determined for subclones, which were stably transfected with a NTC shRNA, or shRNA targeting ADAM12 (shA12-2, shA12-5) and exposed to 20% or 1% O2 for 30 h. Data are shown as mean ± SEM (n = 44 to 50 cells). **P < 0.01, ***P < 0.001 versus NTC cells at 20% O2 at the corresponding time point; #P < 0.05, ##P < 0.01, ###P < 0.001 versus NTC cells at 1% O2 at the corresponding time point (two-way ANOVA with Tukey’s posttest). (B) Cell trajectories (n = 44 to 50) are plotted using (x, y) coordinates obtained at 10-min intervals over a 30-h time course. (Scale bar, 50 μm.) (C) The maximum displacement, total distance, and total diffusivity of subclones were calculated and data are shown as mean ± SEM (n = 44 to 50 cells). *P < 0.05, ***P < 0.001 versus NTC cells at 20% O2; #P < 0.05, ##P < 0.01, ###P < 0.001 versus NTC cells at 1% O2 (two-way ANOVA with Tukey’s posttest for all comparisons).

