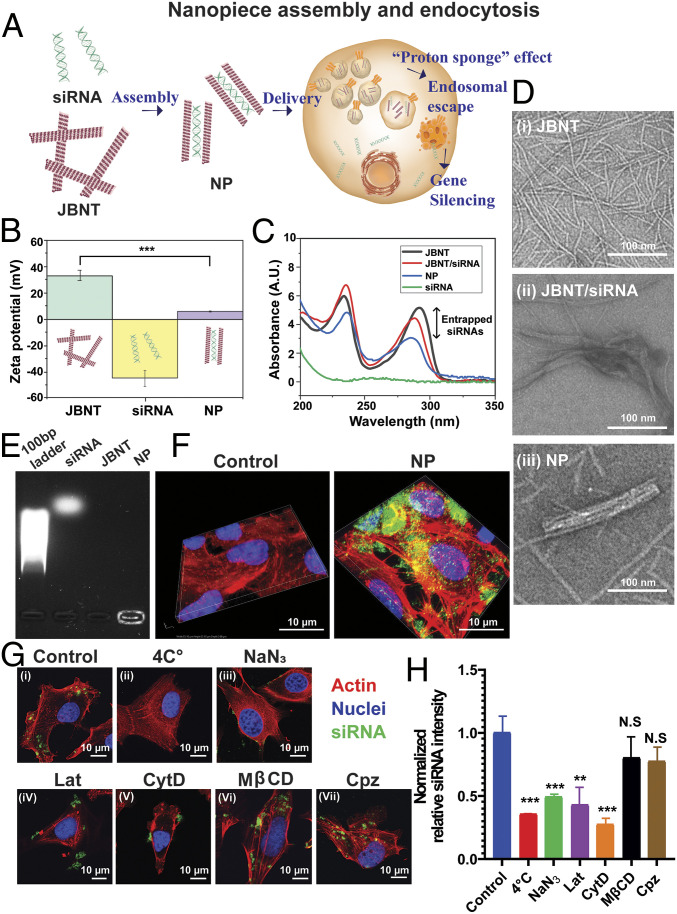
Fig. 1.
NP assembly and endocytosis. (A) Schematic drawing of NPs’ delivery. (B) The ζ-potential analysis. (C) UV-Vis analysis. (D) TEM characterization of the NPs. (E) Gel retardation assay. (F) CLSM z-stack images of siRNA-AF488 (green) delivered by the NPs; cell nuclei stained with DAPI (blue); cell skeleton stained with rhodamine phalloidin (red). (G) Inhibition of NP uptake. (H) Quantitative analysis of NP uptake. The values are mean SEM (n 10). *P < 0.05, **P < 0.01, and ***P < 0.001 compared to control.

