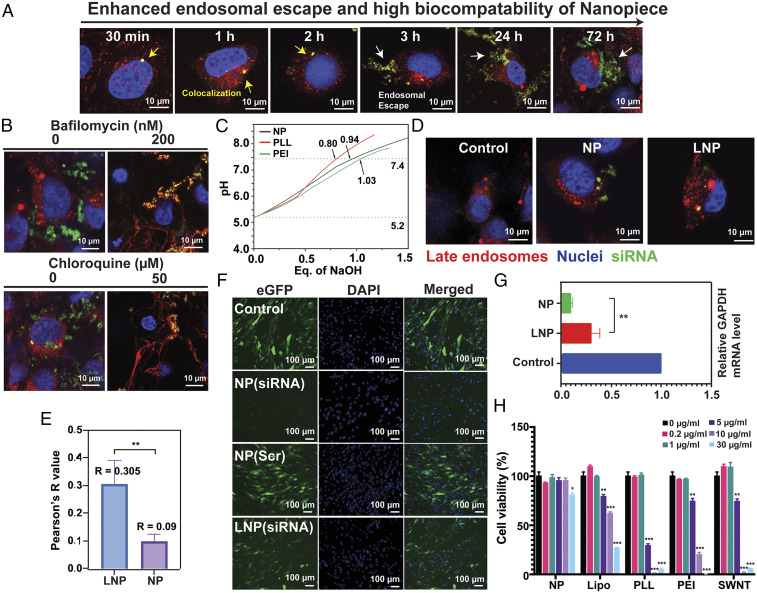
Fig. 2.
Enhanced endosomal escape and high biocompatibility of the NPs. (A) Time-dependent endosomal escape of the NPs. (B) Inhibition of the proton sponge effect. (C) Acid–base titration curves. (D) Endosomal escape of the NPs and LNPs. (E) Quantification of colocalization. (F) Antiviral ability of NP delivery. (G) Inhibition of gene expression of the NPs and LNPs. (H) Cell viability analysis. The data were expressed as the percentage of surviving cells, and the values are mean SEM (n 10). *P < 0.05, **P < 0.01, and ***P < 0.001 compared to untreated control.

